Singapore Airlines 2008 Annual Report Download - page 111
Download and view the complete annual report
Please find page 111 of the 2008 Singapore Airlines annual report below. You can navigate through the pages in the report by either clicking on the pages listed below, or by using the keyword search tool below to find specific information within the annual report.-
 1
1 -
2
-
3
-
4
-
5
-
6
-
7
-
8
-
9
-
10
-
11
-
12
-
13
-
14
-
15
-
16
-
17
-
18
-
19
-
20
-
21
-
22
-
23
-
24
-
25
-
26
-
27
-
28
-
29
-
30
-
31
-
32
-
33
-
34
-
35
-
36
-
37
-
38
-
39
-
40
-
41
-
42
-
43
-
44
-
45
-
46
-
47
-
48
-
49
-
50
-
51
-
52
-
53
-
54
-
55
-
56
-
57
-
58
-
59
-
60
-
61
-
62
-
63
-
64
-
65
-
66
-
67
-
68
-
69
-
70
-
71
-
72
-
73
-
74
-
75
-
76
-
77
-
78
-
79
-
80
-
81
-
82
-
83
-
84
-
85
-
86
-
87
-
88
-
89
-
90
-
91
-
92
-
93
-
94
-
95
-
96
-
97
-
98
-
99
-
100
-
 101
101 -
 102
102 -
 103
103 -
 104
104 -
 105
105 -
 106
106 -
 107
107 -
 108
108 -
 109
109 -
 110
110 -
 111
111 -
 112
112 -
 113
113 -
 114
114 -
 115
115 -
 116
116 -
 117
117 -
 118
118 -
 119
119 -
 120
120 -
 121
121 -
122
-
123
-
124
-
125
-
126
-
127
-
128
-
129
-
130
-
131
-
132
-
133
-
134
-
135
-
136
-
137
-
138
-
139
-
140
-
141
-
142
-
143
-
144
-
145
-
146
-
147
-
148
-
149
-
150
-
151
-
152
-
153
-
154
-
155
-
156
-
157
-
158
-
159
-
160
-
161
-
162
-
163
-
164
-
165
-
166
-
167
-
168
-
169
-
170
-
171
-
172
-
173
-
174
-
175
-
176
-
177
-
178
 |
 |

Singapore Airlines Annual Report 2007-08
109
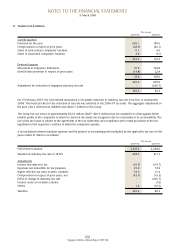
12 Earnings Per Share
The Group
2007-08 2006-07
Basic Diluted Basic Diluted
Profit attributable to equity holders
of the Company (in $ million) 2,049.4 2,049.4 2,128.8 2,128.8
Adjustment for dilutive potential ordinary shares
of subsidiary companies (in $ million) - (5.1) - (4.8)
Adjusted net profit attributable to equity holders
of the Company (in $ million) 2,049.4 2,044.3 2,128.8 2,124.0
Weighted average number of ordinary shares
in issue (in million) 1,216.0 1,216.0 1,233.6 1,233.6
Adjustment for dilutive potential
ordinary shares (in million) - 14.9 - 10.0
Weighted average number of ordinary shares
in issue used for computing earnings per share
(in million) 1,216.0 1,230.9 1,233.6 1,243.6
Earnings per share (cents) 168.5 166.1 172.6 170.8
Basic earnings per share is calculated by dividing the profit attributable to equity holders by the weighted average number
of ordinary shares in issue during the financial year.
For purposes of calculating diluted earnings per share, the profit attributable to equity holders of the Company is adjusted
to take into account effects of dilutive potential ordinary shares of subsidiary companies and the weighted average number
of ordinary shares of the Company in issue is adjusted to take into account effects of dilutive options of the Company.
12.2 million (2006-07: 21.8 million) of the share options granted to employees under the existing employee share option
plans have not been included in the calculation of diluted earnings per share because they are anti-dilutive for the current
and previous years presented.
13 Dividends Paid and Proposed (in $ million)
The Group and the Company
2007-08 2006-07
Dividends paid:
Special dividend of 50.0 cents per share tax exempt (one-tier) in respect of 2006-07 633.0 -
Final dividend of 35.0 cents per share tax exempt (one-tier) in respect of 2006-07
(2006-07: 35.0 cents per share tax exempt [one-tier] in respect of 2005-06) 443.0 429.4
Interim dividend of 20.0 cents per share tax exempt (one-tier) in respect of 2007-08
(2006-07: 15.0 cents per share tax exempt [one-tier] in respect of 2006-07) 237.2 185.4
1,313.2 614.8
The directors propose that a final tax exempt (one-tier) dividend of 80.0 cents per share (2006-07: final tax exempt
[one-tier] dividend of 35.0 cents per share and a special tax exempt [one-tier] dividend of 50.0 cents per share)
amounting to $947.2 million (2006-07: $443.0 million and $633.0 million respectively) be paid for the financial year
ended 31 March 2008.
NOTES TO THE FINANCIAL STATEMENTS
31 March 2008