Singapore Airlines 2008 Annual Report Download - page 65
Download and view the complete annual report
Please find page 65 of the 2008 Singapore Airlines annual report below. You can navigate through the pages in the report by either clicking on the pages listed below, or by using the keyword search tool below to find specific information within the annual report.-
 1
1 -
2
-
3
-
4
-
5
-
6
-
7
-
8
-
9
-
10
-
11
-
12
-
13
-
14
-
15
-
16
-
17
-
18
-
19
-
20
-
21
-
22
-
23
-
24
-
25
-
26
-
27
-
28
-
29
-
30
-
31
-
32
-
33
-
34
-
35
-
36
-
37
-
38
-
39
-
40
-
41
-
42
-
43
-
44
-
45
-
46
-
47
-
48
-
49
-
50
-
51
-
52
-
53
-
54
-
 55
55 -
 56
56 -
 57
57 -
 58
58 -
 59
59 -
 60
60 -
 61
61 -
 62
62 -
 63
63 -
 64
64 -
 65
65 -
 66
66 -
 67
67 -
 68
68 -
 69
69 -
 70
70 -
 71
71 -
 72
72 -
 73
73 -
 74
74 -
 75
75 -
76
-
77
-
78
-
79
-
80
-
81
-
82
-
83
-
84
-
85
-
86
-
87
-
88
-
89
-
90
-
91
-
92
-
93
-
94
-
95
-
96
-
97
-
98
-
99
-
100
-
101
-
102
-
103
-
104
-
105
-
106
-
107
-
108
-
109
-
110
-
111
-
112
-
113
-
114
-
115
-
116
-
117
-
118
-
119
-
120
-
121
-
122
-
123
-
124
-
125
-
126
-
127
-
128
-
129
-
130
-
131
-
132
-
133
-
134
-
135
-
136
-
137
-
138
-
139
-
140
-
141
-
142
-
143
-
144
-
145
-
146
-
147
-
148
-
149
-
150
-
151
-
152
-
153
-
154
-
155
-
156
-
157
-
158
-
159
-
160
-
161
-
162
-
163
-
164
-
165
-
166
-
167
-
168
-
169
-
170
-
171
-
172
-
173
-
174
-
175
-
176
-
177
-
178
 |
 |
EastAsia
Americas
Europe
SouthWestPacific
WestAsiaandAfrica
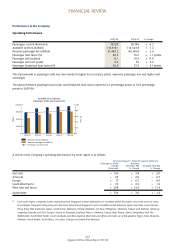
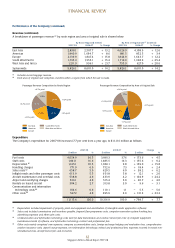
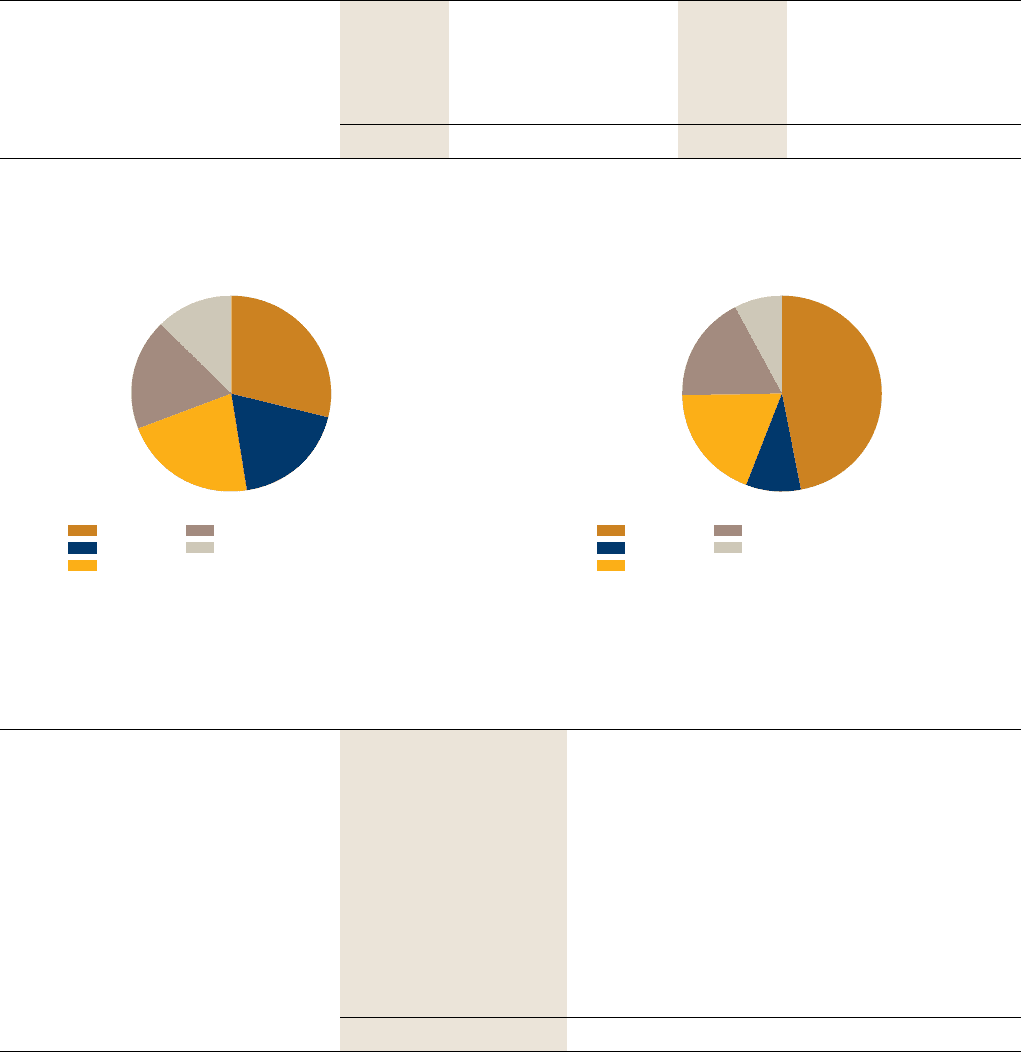
Passenger Revenue Composition by Route Re gion
12.3%
-0.2%point
-1.0%point
+0.3%point
+0.2%point
+0.7%point
28.9%
18.7%
21.8%
18.3%
EastAsia
Americas
Europe
SouthWestPacific
WestAsiaandAfrica
Passenger Revenue Composition by Area of Orig inal Sale
-0.7%point
-1.0%point
-0.3%point
+1.6%points
+0.4%point
7. 7%
47.1%
8.9%
18.8%
17.5%
Singapore Airlines Annual Report 2007-08
63
FINANCIAL REVIEW
Performance of the Company (continued)
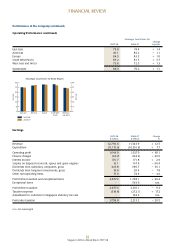
Revenue (continued)
AbreakdownofpassengerrevenueR1byrouteregionandareaoforiginalsaleisshownbelow:
By Route Region ($ million) By Area of Original Sale R2 ($ million)
2007-08 2006-07 % Change 2007-08 2006-07 % Change
EastAsia 2,838.1 2,507.7 + 13.2 4,626.9 4,108.9 + 12.6
Americas 1,840.9 1,694.7 + 8.6 881.5 852.5 + 3.4
Europe 2,139.9 1,847.4 + 15.8 1,844.9 1,643.7 + 12.2
SouthWestPacic 1,795.3 1,555.1 + 15.4 1,716.9 1,368.9 +25.4
WestAsiaandAfrica 1,211.9 996.1 + 21.7 755.9 627.0 + 20.6
Systemwide 9,826.1 8,601.0 + 14.2 9,826.1 8,601.0 + 14.2
R1 Includes excess baggage revenue.
R2 Each area of original sale comprises countries within a region from which the sale is made.
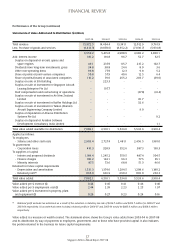
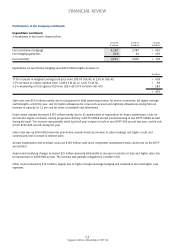
Expenditure
TheCompany’sexpenditurefor2007-08increased7.7percentfromayearago,to$11,116millionasfollows:
2007-08 2006-07 Change
$ million % $ million % $ million %
Fuelcosts 4,054.9 36.5 3,881.3 37.6 +173.6 + 4.5
Staffcosts 1,841.1 16.6 1,685.5 16.3 +155.6 + 9.2
DepreciationR1 1,165.1 10.5 1,006.1 9.8 +159.0 + 15.8
Handlingcharges 771.0 6.9 752.6 7.3 + 18.4 + 2.4
SalescostsR2 658.7 5.9 620.5 6.0 + 38.2 + 6.2
Inightmealsandotherpassengercosts 613.9 5.5 601.8 5.8 + 12.1 + 2.0
Aircraftmaintenanceandoverhaulcosts 538.8 4.9 433.9 4.2 +104.9 + 24.2
Airportandoveryingcharges 536.1 4.8 515.4 5.0 + 20.7 + 4.0
Rentalsonleasedaircraft 304.2 2.7 313.8 3.0 – 9.6 – 3.1
Communicationandinformation
technologycostsR3 104.6 0.9 110.1 1.1 – 5.5 – 5.0
OthercostsR4 527.2 4.8 395.9 3.9 + 131.3 + 33.2
11,115.6 100.0 10,316.9 100.0 +798.7 + 7.7
R1 Depreciation included impairment of property, plant and equipment and amortisation of intangible assets (application software).
R2 Sales costs included commissions and incentives payable, frequent flyer programme costs, computer reservation system booking fees,
advertising expenses and other sales costs.
R3 Communication and information technology costs were for data transmission and contract service fees, hire of computer equipment,
maintenance/rental of software, and information technology contract and professional fees.
R4 Other costs mainly comprised crew expenses, company accommodation costs, foreign exchange hedging and revaluation loss, comprehensive
aviation insurance costs, airport lounge expenses, non-information technology contract and professional fees, expenses incurred to mount non-
scheduled services, aircraft licence fees and recoveries.