Singapore Airlines 2008 Annual Report Download - page 167
Download and view the complete annual report
Please find page 167 of the 2008 Singapore Airlines annual report below. You can navigate through the pages in the report by either clicking on the pages listed below, or by using the keyword search tool below to find specific information within the annual report.-
 1
1 -
2
-
3
-
4
-
5
-
6
-
7
-
8
-
9
-
10
-
11
-
12
-
13
-
14
-
15
-
16
-
17
-
18
-
19
-
20
-
21
-
22
-
23
-
24
-
25
-
26
-
27
-
28
-
29
-
30
-
31
-
32
-
33
-
34
-
35
-
36
-
37
-
38
-
39
-
40
-
41
-
42
-
43
-
44
-
45
-
46
-
47
-
48
-
49
-
50
-
51
-
52
-
53
-
54
-
55
-
56
-
57
-
58
-
59
-
60
-
61
-
62
-
63
-
64
-
65
-
66
-
67
-
68
-
69
-
70
-
71
-
72
-
73
-
74
-
75
-
76
-
77
-
78
-
79
-
80
-
81
-
82
-
83
-
84
-
85
-
86
-
87
-
88
-
89
-
90
-
91
-
92
-
93
-
94
-
95
-
96
-
97
-
98
-
99
-
100
-
101
-
102
-
103
-
104
-
105
-
106
-
107
-
108
-
109
-
110
-
111
-
112
-
113
-
114
-
115
-
116
-
117
-
118
-
119
-
120
-
121
-
122
-
123
-
124
-
125
-
126
-
127
-
128
-
129
-
130
-
131
-
132
-
133
-
134
-
135
-
136
-
137
-
138
-
139
-
140
-
141
-
142
-
143
-
144
-
145
-
146
-
147
-
148
-
149
-
150
-
151
-
152
-
153
-
154
-
155
-
156
-
 157
157 -
 158
158 -
 159
159 -
 160
160 -
 161
161 -
 162
162 -
 163
163 -
 164
164 -
 165
165 -
 166
166 -
 167
167 -
 168
168 -
 169
169 -
 170
170 -
 171
171 -
 172
172 -
 173
173 -
 174
174 -
 175
175 -
 176
176 -
 177
177 -
178
 |
 |
Singapore Airlines Annual Report 2007-08
165
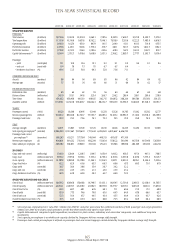
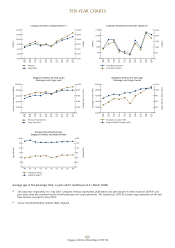
TEN-YEAR STATISTICAL RECORD
2007-08 2006-07 2005-06 2004-05 2003-04 2002-03 2001-02 2000-01 1999-00 1998-99
SINGAPORE AIRLINES
FINANCIAL R1
Total revenue ($ million) 12,759.6 11,343.9 10,302.8 9,260.1 7,187.6 8,047.0 7,694.7 9,125.8 8,200.7 7,072.0
Total expenditure ($ million) 11,115.6 10,316.9 9,651.8 8,562.2 7,046.1 7,838.0 7,281.6 8,222.5 7,485.9 6,616.5
Operating profit ($ million) 1,644.0 1,027.0 651.0 697.9 141.5 209.0 413.1 903.3 714.8 455.5
Profit before taxation ($ million) 2,077.6 2,291.1 940.8 1,570.4 319.7 460.1 740.7 1,607.2 1,641.5 882.3
Profit after taxation ($ million) 1,758.8 2,213.2 746.0 1,283.6 420.6 618.0 567.2 1,422.2 1,267.1 813.7
Capital disbursements R2 ($ million) 1,814.4 2,792.7 1,458.6 1,608.9 2,051.3 2,766.2 2,885.7 2,777.7 3,303.7 1,850.4
Passenger
– yield (cents/pkm) 12.1 10.9 10.6 10.1 9.2 9.1 9.0 9.4 9.1 8.6
– unit cost (cents/ask) 8.4 7.9 7.5 7.0 6.7 6.7 6.4 - - -
– breakeven load factor (%) 69.4 72.5 70.8 69.3 72.8 73.6 71.1 - - -
OPERATING PASSENGER FLEET
Aircraft (numbers) 98 94 90 89 85 96 92 84 84 82
Average age (months) 77 75 76 64 60 71 69 70 62 57
PASSENGER PRODUCTION
Destination cities (numbers) 65 64 62 59 56 60 64 67 69 68
Distance flown (million km) 365.9 353.1 341.8 325.4 266.7 296.2 288.4 289.1 280.6 258.9
Time flown (hours) 474,432 458,936 441,510 419,925 342,715 384,652 368,204 366,784 351,560 334,172
Available seat-km (million) 113,919.1 112,543.8 109,483.7 104,662.3 88,252.7 99,565.9 94,558.5 92,648.0 87,728.3 83,191.7
TRAFFIC
Passengers carried (‘000) 19,120 18,346 16,995 15,944 13,278 15,326 14,765 15,002 13,782 12,777
Revenue passenger-km (million) 91,485.2 89,148.8 82,741.7 77,593.7 64,685.2 74,183.2 69,994.5 71,118.4 65,718.4 60,299.9
Passenger load factor (%) 80.3 79.2 75.6 74.1 73.3 74.5 74.0 76.8 74.9 72.5
STAFF
Average strength (numbers) 14,071 13,847 13,729 13,572 14,010 14,418 14,205 14,254 13,720 13,690
Seat capacity per employee
R3 (seat-km) 8,096,020 8,127,667 7,974,630 7,711,634 6,299,265 6,905,667 6,656,705 - - -
Passenger load carried
per employee R4 (tonne-km) 618,295 613,211 577,784 549,904 448,513 495,617 471,300 - - -
Revenue per employee ($) 906,801 819,232 750,441 682,294 513,034 558,122 541,690 647,516 607,966 526,859
Valueaddedperemployee ($) 368,382 368,831 258,810 301,024 179,272 191,566 189,806 284,369 291,494 228,254
SIA CARGO
Cargo and mail carried (million kg) 1,308.0 1,284.9 1,248.5 1,149.5 1,050.9 1,043.2 938.5 975.4 905.1 768.5
Cargo load (million tonne-km) 7,959.2 7,995.6 7,874.4 7,333.2 6,749.4 6,913.6 6,039.8 6,167.6 5,775.4 5,025.7
Gross capacity (million tonne-km) 12,787.8 12,889.8 12,378.9 11,544.1 10,156.5 9,927.1 8,950.3 8,876.1 8,244.4 7,403.6
Cargo load factor (%) 62.2 62.0 63.6 63.5 66.5 69.6 67.5 69.5 70.1 67.9
Cargo yield (cents/ltk) 38.7 38.4 38.6 35.9 36.7 34.2 32.2 - - -
Cargo unit cost (cents/ctk) 23.4 24.5 23.5 21.3 23.0 23.9 23.2 - - -
Cargo breakeven load factor (%) 60.5 63.8 60.9 59.3 62.7 69.9 72.0 - - -
SINGAPORE AIRLINES AND SIA CARGO
Overall load (million tonne-km) 16,659.2 16,486.8 15,806.8 14,796.5 13,033.1 14,059.5 12,734.6 12,985.3 12,038.4 10,765.5
Overall capacity (million tonne-km) 24,052.1 24,009.7 23,208.0 21,882.5 18,873.8 19,773.7 18,305.1 18,034.0 16,917.2 15,651.8
Overall load factor (%) 69.3 68.7 68.1 67.6 69.1 71.1 69.6 72.0 71.2 68.8
Overall yield (cents/ltk) 85.0 77.5 74.6 70.8 65.0 64.5 64.9 67.9 66.0 63.7
Overall unit cost (cents/ctk) 52.3 50.0 47.7 44.5 43.4 45.5 44.9 45.4 43.7 42.6
Overall breakeven load factor
(%) 61.5 64.5 63.9 62.9 66.8 70.5 69.2 66.9 66.2 66.9
R1 SIA Cargo was corporatised on 1 July 2001. Statistics for 2000-01 and prior years show the combined numbers of both passenger and cargo operations.
Statistics for 2001-02 includes cargo operations for the first three months only (April to June 2001).
R2 Capital disbursements comprised capital expenditure, investments in joint venture, subsidiary and associated companies, and additional long-term
investments.
R3 Seat capacity per employee is available seat capacity divided by Singapore Airlines average staff strength.
R4 Passenger load carried per employee is defined as passenger load and excess baggage carried divided by Singapore Airlines average staff strength.