Singapore Airlines 2008 Annual Report Download - page 60
Download and view the complete annual report
Please find page 60 of the 2008 Singapore Airlines annual report below. You can navigate through the pages in the report by either clicking on the pages listed below, or by using the keyword search tool below to find specific information within the annual report.-
 1
1 -
2
-
3
-
4
-
5
-
6
-
7
-
8
-
9
-
10
-
11
-
12
-
13
-
14
-
15
-
16
-
17
-
18
-
19
-
20
-
21
-
22
-
23
-
24
-
25
-
26
-
27
-
28
-
29
-
30
-
31
-
32
-
33
-
34
-
35
-
36
-
37
-
38
-
39
-
40
-
41
-
42
-
43
-
44
-
45
-
46
-
47
-
48
-
49
-
 50
50 -
 51
51 -
 52
52 -
 53
53 -
 54
54 -
 55
55 -
 56
56 -
 57
57 -
 58
58 -
 59
59 -
 60
60 -
 61
61 -
 62
62 -
 63
63 -
 64
64 -
 65
65 -
 66
66 -
 67
67 -
 68
68 -
 69
69 -
 70
70 -
71
-
72
-
73
-
74
-
75
-
76
-
77
-
78
-
79
-
80
-
81
-
82
-
83
-
84
-
85
-
86
-
87
-
88
-
89
-
90
-
91
-
92
-
93
-
94
-
95
-
96
-
97
-
98
-
99
-
100
-
101
-
102
-
103
-
104
-
105
-
106
-
107
-
108
-
109
-
110
-
111
-
112
-
113
-
114
-
115
-
116
-
117
-
118
-
119
-
120
-
121
-
122
-
123
-
124
-
125
-
126
-
127
-
128
-
129
-
130
-
131
-
132
-
133
-
134
-
135
-
136
-
137
-
138
-
139
-
140
-
141
-
142
-
143
-
144
-
145
-
146
-
147
-
148
-
149
-
150
-
151
-
152
-
153
-
154
-
155
-
156
-
157
-
158
-
159
-
160
-
161
-
162
-
163
-
164
-
165
-
166
-
167
-
168
-
169
-
170
-
171
-
172
-
173
-
174
-
175
-
176
-
177
-
178
 |
 |

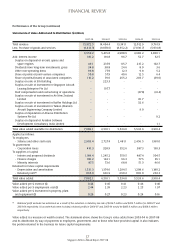
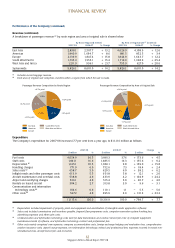
Group Valued Added Distribution
2007-08
33.8%
41.0%
19.4%
5.8%
Totalvalueadded
Amount Distribution
$million %
Employees 2,903.441.0
RetainedintheBusiness2,396.3 33.8
SuppliersofCapital1,372.1 19.4
Government 410.35.8
Dollar
Dollar
ValueAddedPer$EmploymentCost
ValueAddedPer$Revenue
ValueAddedPer$InvestmentinProperty,
PlantandEquipment
0.0
0.5
1.0
1.5
2.0
2.5
3.0
0.0
0.5
1.0
1.5
2.0
2.5
3.0
2007-082006-072005-062004-052003-04
Group Value Added Productivity Ratios
$Million
$Million
RetainedintheBusiness
Employees
SuppliersofCapital
Government
0
500
1,000
1,500
2,000
2,500
3,000
0
500
1,000
1,500
2,000
2,500
3,000
2007-082006-072005-062004-052003-04
Group Value Added Distribution
R1
R1
R1 Excludes write-back of prior years’ tax liabilities of $204.7 million
and $246.7 million for 2003-04 and 2006-07 respectively arising
from reduction in statutory tax rate.
Singapore Airlines Annual Report 2007-08
58
FINANCIAL REVIEW
Performance of the Group (continued)
Value Added
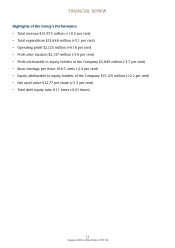
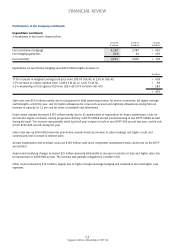
Totalvalueaddedfor2007-08improved8.8percent(+$572million)to$7,082million.Theincreasewasmainlyattributable
tohigherrevenue(+$1,478million),partiallyoffsetbyone-offgainsfromsurplusonsaleofSIABuildingandsaleofinvestment
inSingaporeAircraftLeasingEnterpriselastyear(-$421million),higherpurchaseofgoodsandservices(-$335million)and
lowersurplusondisposalofaircraft,sparesandspareengines(-$189million).
Salariesandotherstaffcostaccountedfor41.0percentofthevalueadded,0.9percentagepointlowerthanthepreviousyear.
$1,184million(16.7percent)ofthevalueaddedwasfordistributiontoequityholdersoftheCompany(-2.4percentagepoints)
and$2,396million(33.8percent)wasretainedforfuturecapitalrequirements(+2.9percentagepoints).