Singapore Airlines 2008 Annual Report Download - page 106
Download and view the complete annual report
Please find page 106 of the 2008 Singapore Airlines annual report below. You can navigate through the pages in the report by either clicking on the pages listed below, or by using the keyword search tool below to find specific information within the annual report.-
 1
1 -
2
-
3
-
4
-
5
-
6
-
7
-
8
-
9
-
10
-
11
-
12
-
13
-
14
-
15
-
16
-
17
-
18
-
19
-
20
-
21
-
22
-
23
-
24
-
25
-
26
-
27
-
28
-
29
-
30
-
31
-
32
-
33
-
34
-
35
-
36
-
37
-
38
-
39
-
40
-
41
-
42
-
43
-
44
-
45
-
46
-
47
-
48
-
49
-
50
-
51
-
52
-
53
-
54
-
55
-
56
-
57
-
58
-
59
-
60
-
61
-
62
-
63
-
64
-
65
-
66
-
67
-
68
-
69
-
70
-
71
-
72
-
73
-
74
-
75
-
76
-
77
-
78
-
79
-
80
-
81
-
82
-
83
-
84
-
85
-
86
-
87
-
88
-
89
-
90
-
91
-
92
-
93
-
94
-
95
-
 96
96 -
 97
97 -
 98
98 -
 99
99 -
 100
100 -
 101
101 -
 102
102 -
 103
103 -
 104
104 -
 105
105 -
 106
106 -
 107
107 -
 108
108 -
 109
109 -
 110
110 -
 111
111 -
 112
112 -
 113
113 -
 114
114 -
 115
115 -
 116
116 -
117
-
118
-
119
-
120
-
121
-
122
-
123
-
124
-
125
-
126
-
127
-
128
-
129
-
130
-
131
-
132
-
133
-
134
-
135
-
136
-
137
-
138
-
139
-
140
-
141
-
142
-
143
-
144
-
145
-
146
-
147
-
148
-
149
-
150
-
151
-
152
-
153
-
154
-
155
-
156
-
157
-
158
-
159
-
160
-
161
-
162
-
163
-
164
-
165
-
166
-
167
-
168
-
169
-
170
-
171
-
172
-
173
-
174
-
175
-
176
-
177
-
178
 |
 |

Singapore Airlines Annual Report 2007-08
104
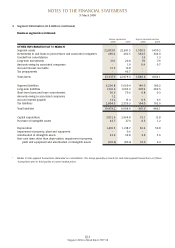
4 Segment Information (in $ million) (continued)
Business segments (continued)
Airline operations Airport terminal services
2008 2007 2008 2007
OTHER INFORMATION AT 31 MARCH
Segment assets 22,873.0 22,691.5 1,505.5 1,450.2
Investments in and loans to joint venture and associated companies 430.4 202.5 334.5 344.0
Goodwill on consolidation - - 1.3 1.3
Long-term investments 21.0 20.8 7.9 7.9
Amounts owing by associated companies - 1.0 0.4 0.7
Accrued interest receivable 13.5 16.8 - -
Tax prepayments - 46.7 - -
Total assets 23,337.9 22,979.3 1,849.6 1,804.1
Segment liabilities 6,206.8 5,660.4 149.0 180.2
Long-term liabilities 1,391.9 1,603.3 207.3 202.5
Short-term loans and lease commitments 56.6 70.6 0.8 0.3
Amounts owing to associated companies 1.2 - - -
Accrued interest payable 13.2 15.3 0.5 0.5
Tax liabilities 2,804.5 2,559.3 104.0 102.6
Total liabilities 10,474.2 9,908.9 461.6 486.1
Capital expenditure 2,012.6 2,964.8 15.1 12.8
Purchase of intangible assets 43.7 27.3 0.5 1.2
Depreciation 1,401.5 1,218.7 56.4 59.8
Impairment of property, plant and equipment - 0.6 - -
Amortisation of intangible assets 32.9 39.8 2.8 5.9
Non-cash items other than depreciation, impairment of property,
plant and equipment and amortisation of intangible assets (101.4) (86.6) 10.0 6.4
* Relates to inter-segment transactions eliminated on consolidation. The Group generally accounts for such inter-segment transactions as if these
transactions were to third parties at current market prices.
NOTES TO THE FINANCIAL STATEMENTS
31 March 2008