Singapore Airlines 2008 Annual Report Download - page 174
Download and view the complete annual report
Please find page 174 of the 2008 Singapore Airlines annual report below. You can navigate through the pages in the report by either clicking on the pages listed below, or by using the keyword search tool below to find specific information within the annual report.-
 1
1 -
2
-
3
-
4
-
5
-
6
-
7
-
8
-
9
-
10
-
11
-
12
-
13
-
14
-
15
-
16
-
17
-
18
-
19
-
20
-
21
-
22
-
23
-
24
-
25
-
26
-
27
-
28
-
29
-
30
-
31
-
32
-
33
-
34
-
35
-
36
-
37
-
38
-
39
-
40
-
41
-
42
-
43
-
44
-
45
-
46
-
47
-
48
-
49
-
50
-
51
-
52
-
53
-
54
-
55
-
56
-
57
-
58
-
59
-
60
-
61
-
62
-
63
-
64
-
65
-
66
-
67
-
68
-
69
-
70
-
71
-
72
-
73
-
74
-
75
-
76
-
77
-
78
-
79
-
80
-
81
-
82
-
83
-
84
-
85
-
86
-
87
-
88
-
89
-
90
-
91
-
92
-
93
-
94
-
95
-
96
-
97
-
98
-
99
-
100
-
101
-
102
-
103
-
104
-
105
-
106
-
107
-
108
-
109
-
110
-
111
-
112
-
113
-
114
-
115
-
116
-
117
-
118
-
119
-
120
-
121
-
122
-
123
-
124
-
125
-
126
-
127
-
128
-
129
-
130
-
131
-
132
-
133
-
134
-
135
-
136
-
137
-
138
-
139
-
140
-
141
-
142
-
143
-
144
-
145
-
146
-
147
-
148
-
149
-
150
-
151
-
152
-
153
-
154
-
155
-
156
-
157
-
158
-
159
-
160
-
161
-
162
-
163
-
 164
164 -
 165
165 -
 166
166 -
 167
167 -
 168
168 -
 169
169 -
 170
170 -
 171
171 -
 172
172 -
 173
173 -
 174
174 -
 175
175 -
 176
176 -
 177
177 -
 178
178
 |
 |
Share Price
Volume (Million Stock Units)
Index
0
20
40
60
80
100
1,000
1,500
2,000
2,500
3,000
3,500
4,000
Mar
08
Feb
08
Jan
08
Dec
07
Nov
07
Oct
07
Sep
07
Aug
07
Jul
07
Jun
07
May
07
Apr
07
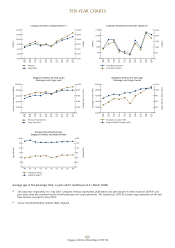
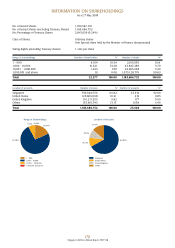
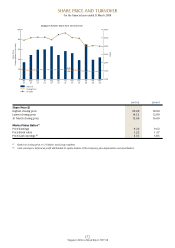
Singapore Airlines Share Price and Turnover
Turnover
Closing Price
ST Index
High
Low
Singapore Airlines Annual Report 2007-08
172
SHARE PRICE AND TURNOVER
For the financial year ended 31 March 2008
2007-08 2006-07
Share Price ($)
Highest closing price 20.20 18.00
Lowest closing price 14.12 12.00
31 March closing price 15.60 16.60
Market Value Ratios R1
Price/Earnings 9.26 9.62
Price/Book value 1.22 1.37
Price/Cash earnings R2 5.31 5.85
R1 Based on closing price on 31 March and Group numbers.
R2 Cash earnings is defined as profit attributable to equity holders of the Company plus depreciation and amortisation.