Singapore Airlines 2008 Annual Report Download - page 168
Download and view the complete annual report
Please find page 168 of the 2008 Singapore Airlines annual report below. You can navigate through the pages in the report by either clicking on the pages listed below, or by using the keyword search tool below to find specific information within the annual report.-
 1
1 -
2
-
3
-
4
-
5
-
6
-
7
-
8
-
9
-
10
-
11
-
12
-
13
-
14
-
15
-
16
-
17
-
18
-
19
-
20
-
21
-
22
-
23
-
24
-
25
-
26
-
27
-
28
-
29
-
30
-
31
-
32
-
33
-
34
-
35
-
36
-
37
-
38
-
39
-
40
-
41
-
42
-
43
-
44
-
45
-
46
-
47
-
48
-
49
-
50
-
51
-
52
-
53
-
54
-
55
-
56
-
57
-
58
-
59
-
60
-
61
-
62
-
63
-
64
-
65
-
66
-
67
-
68
-
69
-
70
-
71
-
72
-
73
-
74
-
75
-
76
-
77
-
78
-
79
-
80
-
81
-
82
-
83
-
84
-
85
-
86
-
87
-
88
-
89
-
90
-
91
-
92
-
93
-
94
-
95
-
96
-
97
-
98
-
99
-
100
-
101
-
102
-
103
-
104
-
105
-
106
-
107
-
108
-
109
-
110
-
111
-
112
-
113
-
114
-
115
-
116
-
117
-
118
-
119
-
120
-
121
-
122
-
123
-
124
-
125
-
126
-
127
-
128
-
129
-
130
-
131
-
132
-
133
-
134
-
135
-
136
-
137
-
138
-
139
-
140
-
141
-
142
-
143
-
144
-
145
-
146
-
147
-
148
-
149
-
150
-
151
-
152
-
153
-
154
-
155
-
156
-
157
-
 158
158 -
 159
159 -
 160
160 -
 161
161 -
 162
162 -
 163
163 -
 164
164 -
 165
165 -
 166
166 -
 167
167 -
 168
168 -
 169
169 -
 170
170 -
 171
171 -
 172
172 -
 173
173 -
 174
174 -
 175
175 -
 176
176 -
 177
177 -
 178
178
 |
 |
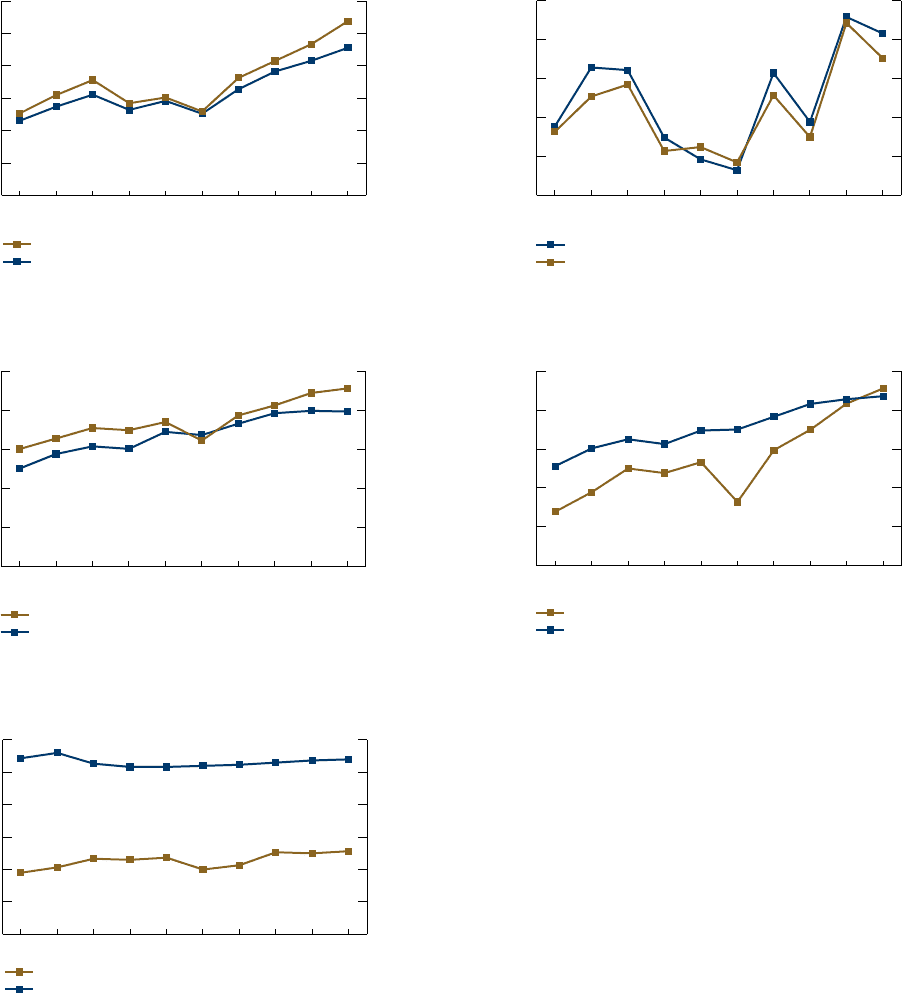
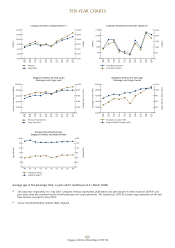
Passengers Carried (’000)
Cargo and Mail Tonnage (’000)
Revenue Passenger-km
Cargo Tonne-km
$ Million
$ Million
Revenue
Expenditure
2,000
4,000
6,000
8,000
10,000
12,000
14,000
2,000
4,000
6,000
8,000
10,000
12,000
14,000
07
08
06
07
05
06
04
05
03
04
02
03
01
02
00
01
99
00
98
99
Company Revenue and Expenditure R1
Passengers Carried (’000)
Cargo & Mail Tonnage (’000)
10,000
12,000
14,000
16,000
18,000
20,000
0
300
600
900
1,200
1,500
07
08
06
07
05
06
04
05
03
04
02
03
01
02
00
01
99
00
98
99
Singapore Airlines and SIA Cargo
Passenger and Cargo Carried
$ Million
$ Million
Profit Before Taxation
Profit After Taxation
0
500
1,000
1,500
2,000
2,500
0
500
1,000
1,500
2,000
2,500
07
08
06
07
05
06
04
05
03
04
02
03
01
02
00
01
99
00
98
99
Company Profit Before and After Taxation R1
Age (Months)
Age (Months)
0
30
60
90
120
150
180
0
30
60
90
120
150
180
08070605040302010099
Average Operating Fleet Age:
Singapore Airlines and Industry Wide
Singapore Airlines
Industrial Wide R2
Revenue Passenger-Km (Million)
Cargo Tonne-Km (Million)
0
20,000
40,000
60,000
80,000
100,000
0
2,000
4,000
6,000
8,000
10,000
07
08
06
07
05
06
04
05
03
04
02
03
01
02
00
01
99
00
98
99
Singapore Airlines and SIA Cargo
Passenger and Cargo Load
Singapore Airlines Annual Report 2007-08
166
TEN-YEAR CHARTS
Average age of SIA passenger fleet: 6 years and 5 months (as at 31 March 2008).
R1 SIA Cargo was corporatised on 1 July 2001. Company revenue, expenditure, profit before and after taxation in these charts for 2000-01 and
prior years show the combined results of both passenger and cargo operations. The numbers for 2001-02 include cargo operations for the first
three months only (April to June 2001).
R2 Source: Avsoft Information Systems, Ruby, England.