Singapore Airlines 2008 Annual Report Download - page 164
Download and view the complete annual report
Please find page 164 of the 2008 Singapore Airlines annual report below. You can navigate through the pages in the report by either clicking on the pages listed below, or by using the keyword search tool below to find specific information within the annual report.-
 1
1 -
2
-
3
-
4
-
5
-
6
-
7
-
8
-
9
-
10
-
11
-
12
-
13
-
14
-
15
-
16
-
17
-
18
-
19
-
20
-
21
-
22
-
23
-
24
-
25
-
26
-
27
-
28
-
29
-
30
-
31
-
32
-
33
-
34
-
35
-
36
-
37
-
38
-
39
-
40
-
41
-
42
-
43
-
44
-
45
-
46
-
47
-
48
-
49
-
50
-
51
-
52
-
53
-
54
-
55
-
56
-
57
-
58
-
59
-
60
-
61
-
62
-
63
-
64
-
65
-
66
-
67
-
68
-
69
-
70
-
71
-
72
-
73
-
74
-
75
-
76
-
77
-
78
-
79
-
80
-
81
-
82
-
83
-
84
-
85
-
86
-
87
-
88
-
89
-
90
-
91
-
92
-
93
-
94
-
95
-
96
-
97
-
98
-
99
-
100
-
101
-
102
-
103
-
104
-
105
-
106
-
107
-
108
-
109
-
110
-
111
-
112
-
113
-
114
-
115
-
116
-
117
-
118
-
119
-
120
-
121
-
122
-
123
-
124
-
125
-
126
-
127
-
128
-
129
-
130
-
131
-
132
-
133
-
134
-
135
-
136
-
137
-
138
-
139
-
140
-
141
-
142
-
143
-
144
-
145
-
146
-
147
-
148
-
149
-
150
-
151
-
152
-
153
-
 154
154 -
 155
155 -
 156
156 -
 157
157 -
 158
158 -
 159
159 -
 160
160 -
 161
161 -
 162
162 -
 163
163 -
 164
164 -
 165
165 -
 166
166 -
 167
167 -
 168
168 -
 169
169 -
 170
170 -
 171
171 -
 172
172 -
 173
173 -
 174
174 -
175
-
176
-
177
-
178
 |
 |

Singapore Airlines Annual Report 2007-08
162
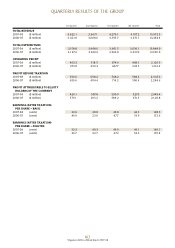
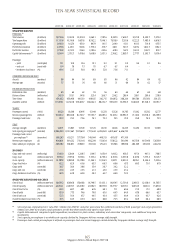
QUARTERLY RESULTS OF THE GROUP
1st Quarter 2nd Quarter 3rd Quarter 4th Quarter Total
TOTAL REVENUE
2007-08 ($ million) 3,622.1 3,967.1 4,276.1 4,107.2 15,972.5
2006-07 ($ million) 3,421.0 3,608.6 3,793.7 3,671.1 14,494.4
TOTAL EXPENDITURE
2007-08 ($ million) 3,158.8 3,448.6 3,601.5 3,639.1 13,848.0
2006-07 ($ million) 3,147.2 3,349.2 3,346.0 3,337.6 13,180.0
OPERATING PROFIT
2007-08 ($ million) 463.3 518.5 674.6 468.1 2,124.5
2006-07 ($ million) 273.8 259.4 447.7 333.5 1,314.4
PROFIT BEFORE TAXATION
2007-08 ($ million) 556.6 658.2 748.2 584.2 2,547.2
2006-07 ($ million) 659.6 404.4 714.2 506.4 2,284.6
PROFIT ATTRIBUTABLE TO EQUITY
HOLDERS OF THE COMPANY
2007-08 ($ million) 424.1 507.8 590.0 527.5 2,049.4
2006-07 ($ million) 575.1 293.2 589.2 671.3 2,128.8
EARNINGS (AFTER TAXATION)
PER SHARE – BASIC
2007-08 (cents) 33.9 40.8 49.8 44.5 168.5
2006-07 (cents) 46.9 23.9 47.7 53.9 172.6
EARNINGS (AFTER TAXATION)
PER SHARE – DILUTED
2007-08 (cents) 33.3 40.3 49.0 44.1 166.1
2006-07 (cents) 46.7 23.7 47.2 53.2 170.8