Singapore Airlines 2008 Annual Report Download - page 64
Download and view the complete annual report
Please find page 64 of the 2008 Singapore Airlines annual report below. You can navigate through the pages in the report by either clicking on the pages listed below, or by using the keyword search tool below to find specific information within the annual report.-
 1
1 -
2
-
3
-
4
-
5
-
6
-
7
-
8
-
9
-
10
-
11
-
12
-
13
-
14
-
15
-
16
-
17
-
18
-
19
-
20
-
21
-
22
-
23
-
24
-
25
-
26
-
27
-
28
-
29
-
30
-
31
-
32
-
33
-
34
-
35
-
36
-
37
-
38
-
39
-
40
-
41
-
42
-
43
-
44
-
45
-
46
-
47
-
48
-
49
-
50
-
51
-
52
-
53
-
 54
54 -
 55
55 -
 56
56 -
 57
57 -
 58
58 -
 59
59 -
 60
60 -
 61
61 -
 62
62 -
 63
63 -
 64
64 -
 65
65 -
 66
66 -
 67
67 -
 68
68 -
 69
69 -
 70
70 -
 71
71 -
 72
72 -
 73
73 -
 74
74 -
75
-
76
-
77
-
78
-
79
-
80
-
81
-
82
-
83
-
84
-
85
-
86
-
87
-
88
-
89
-
90
-
91
-
92
-
93
-
94
-
95
-
96
-
97
-
98
-
99
-
100
-
101
-
102
-
103
-
104
-
105
-
106
-
107
-
108
-
109
-
110
-
111
-
112
-
113
-
114
-
115
-
116
-
117
-
118
-
119
-
120
-
121
-
122
-
123
-
124
-
125
-
126
-
127
-
128
-
129
-
130
-
131
-
132
-
133
-
134
-
135
-
136
-
137
-
138
-
139
-
140
-
141
-
142
-
143
-
144
-
145
-
146
-
147
-
148
-
149
-
150
-
151
-
152
-
153
-
154
-
155
-
156
-
157
-
158
-
159
-
160
-
161
-
162
-
163
-
164
-
165
-
166
-
167
-
168
-
169
-
170
-
171
-
172
-
173
-
174
-
175
-
176
-
177
-
178
 |
 |

$Million
$Million
0
2,000
4,000
6,000
8,000
10,000
0
2,000
4,000
6,000
8,000
10,000
2007-082006-072005-062004-052003-04
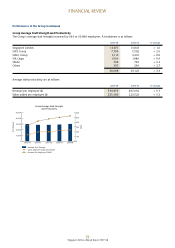
Passenger Revenue
Singapore Airlines Annual Report 2007-08
62
FINANCIAL REVIEW
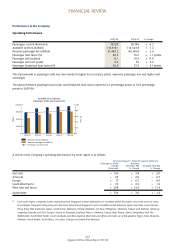
Performance of the Company (continued)
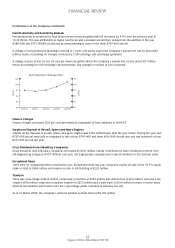
Revenue
TheCompany’srevenueincreased12.5percentto$12,760millionasfollows:
2007-08 2006-07 Change
$ million $ million %
Passengerrevenue 9,797.9 8,573.4 + 14.3
Excessbaggagerevenue 28.2 27.6 + 2.2
Non-scheduledservices 6.4 4.5 + 42.2
BellyholdrevenuefromSIACargo 1,206.4 1,157.3 + 4.2
Directoperatingrevenue 11,038.9 9,762.8 + 13.1
Indirectoperatingrevenue 1,720.7 1,581.1 + 8.8
Totaloperatingrevenue 12,759.6 11,343.9 + 12.5
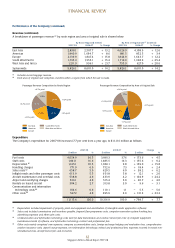
The14.3%increaseinpassengerrevenuewastheresultof:
$ million $ million
2.6%increaseinpassengertrafc:
1.2%increaseinseatcapacity + 103.0
1.1%pointsincreaseinpassengerloadfactor + 120.1 + 223.1
11.5%increaseinpassengeryield(excludingfuelsurcharge):
Higherlocalcurrencyyields + 839.4
Changeinpassengermix + 144.3
Foreignexchange + 17.7 +1,001.4
Increaseinpassengerrevenue +1,224.5
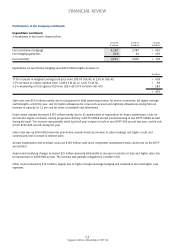
Bellyholdrevenueincreased4.2percentto$1,206millionduetohighernetbellyholdcapacity(+10.2percent)becauseof
increasedpassengeroperationsandrecoveryofhigherfuelcostsfromSIACargo.
Indirectoperatingrevenueincreased8.8percentto$1,721million.Thiswasmainlyduetohigherfuelsurcharge,partially
offsetbylowerotherincidentalrevenue.
Thesensitivityofpassengerrevenuetoaonepercentagepointchangeinpassengerloadfactorandaonepercentagechange
inpassengeryieldisasfollows:
$ million
1.0%pointchangeinpassengerloadfactor,ifyieldandseatcapacityremainconstant 122.0
1.0%changeinpassengeryield,ifpassengertrafcremainsconstant 98.0