HSBC 2011 Annual Report Download - page 94
Download and view the complete annual report
Please find page 94 of the 2011 HSBC annual report below. You can navigate through the pages in the report by either clicking on the pages listed below, or by using the keyword search tool below to find specific information within the annual report.-
 1
1 -
2
-
3
-
4
-
5
-
6
-
7
-
8
-
9
-
10
-
11
-
12
-
13
-
14
-
15
-
16
-
17
-
18
-
19
-
20
-
21
-
22
-
23
-
24
-
25
-
26
-
27
-
28
-
29
-
30
-
31
-
32
-
33
-
34
-
35
-
36
-
37
-
38
-
39
-
40
-
41
-
42
-
43
-
44
-
45
-
46
-
47
-
48
-
49
-
50
-
51
-
52
-
53
-
54
-
55
-
56
-
57
-
58
-
59
-
60
-
61
-
62
-
63
-
64
-
65
-
66
-
67
-
68
-
69
-
70
-
71
-
72
-
73
-
74
-
75
-
76
-
77
-
78
-
79
-
80
-
81
-
82
-
83
-
 84
84 -
 85
85 -
 86
86 -
 87
87 -
 88
88 -
 89
89 -
 90
90 -
 91
91 -
 92
92 -
 93
93 -
 94
94 -
 95
95 -
 96
96 -
 97
97 -
 98
98 -
 99
99 -
 100
100 -
 101
101 -
 102
102 -
 103
103 -
 104
104 -
105
-
106
-
107
-
108
-
109
-
110
-
111
-
112
-
113
-
114
-
115
-
116
-
117
-
118
-
119
-
120
-
121
-
122
-
123
-
124
-
125
-
126
-
127
-
128
-
129
-
130
-
131
-
132
-
133
-
134
-
135
-
136
-
137
-
138
-
139
-
140
-
141
-
142
-
143
-
144
-
145
-
146
-
147
-
148
-
149
-
150
-
151
-
152
-
153
-
154
-
155
-
156
-
157
-
158
-
159
-
160
-
161
-
162
-
163
-
164
-
165
-
166
-
167
-
168
-
169
-
170
-
171
-
172
-
173
-
174
-
175
-
176
-
177
-
178
-
179
-
180
-
181
-
182
-
183
-
184
-
185
-
186
-
187
-
188
-
189
-
190
-
191
-
192
-
193
-
194
-
195
-
196
-
197
-
198
-
199
-
200
-
201
-
202
-
203
-
204
-
205
-
206
-
207
-
208
-
209
-
210
-
211
-
212
-
213
-
214
-
215
-
216
-
217
-
218
-
219
-
220
-
221
-
222
-
223
-
224
-
225
-
226
-
227
-
228
-
229
-
230
-
231
-
232
-
233
-
234
-
235
-
236
-
237
-
238
-
239
-
240
-
241
-
242
-
243
-
244
-
245
-
246
-
247
-
248
-
249
-
250
-
251
-
252
-
253
-
254
-
255
-
256
-
257
-
258
-
259
-
260
-
261
-
262
-
263
-
264
-
265
-
266
-
267
-
268
-
269
-
270
-
271
-
272
-
273
-
274
-
275
-
276
-
277
-
278
-
279
-
280
-
281
-
282
-
283
-
284
-
285
-
286
-
287
-
288
-
289
-
290
-
291
-
292
-
293
-
294
-
295
-
296
-
297
-
298
-
299
-
300
-
301
-
302
-
303
-
304
-
305
-
306
-
307
-
308
-
309
-
310
-
311
-
312
-
313
-
314
-
315
-
316
-
317
-
318
-
319
-
320
-
321
-
322
-
323
-
324
-
325
-
326
-
327
-
328
-
329
-
330
-
331
-
332
-
333
-
334
-
335
-
336
-
337
-
338
-
339
-
340
-
341
-
342
-
343
-
344
-
345
-
346
-
347
-
348
-
349
-
350
-
351
-
352
-
353
-
354
-
355
-
356
-
357
-
358
-
359
-
360
-
361
-
362
-
363
-
364
-
365
-
366
-
367
-
368
-
369
-
370
-
371
-
372
-
373
-
374
-
375
-
376
-
377
-
378
-
379
-
380
-
381
-
382
-
383
-
384
-
385
-
386
-
387
-
388
-
389
-
390
-
391
-
392
-
393
-
394
-
395
-
396
-
397
-
398
-
399
-
400
-
401
-
402
-
403
-
404
-
405
-
406
-
407
-
408
-
409
-
410
-
411
-
412
-
413
-
414
-
415
-
416
-
417
-
418
-
419
-
420
-
421
-
422
-
423
-
424
-
425
-
426
-
427
-
428
-
429
-
430
-
431
-
432
-
433
-
434
-
435
-
436
-
437
-
438
-
439
-
440
 |
 |

HSBC HOLDINGS PLC
Report of the Directors: Operating and Financial Review (continued)
Geographical regions > Latin America
92
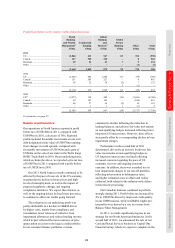
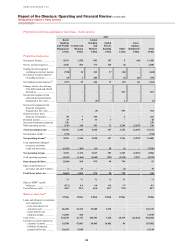
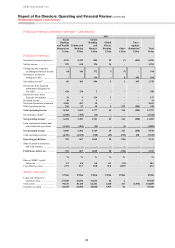
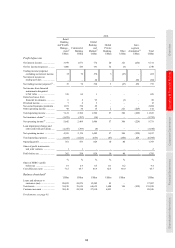
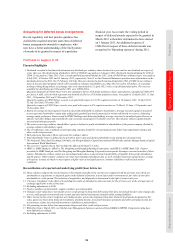
Profit/(loss) before tax and balance sheet data – Latin America
2011
Retail
Banking
and Wealth
Management
US$m
Commercial
Banking
US$m
Global
Banking
and
Markets
US$m
Global
Private
Banking
US$m
Other
US$m
Inter-
segment
elimination64
US$m
Total
US$m
Profit/(loss) before tax
Net interest income/(expense) .... 4,519 2,229 882 25 (7) (692) 6,956
Net fee income ............................ 939 610 196 36 – – 1,781
Trading income/(expense)
excluding net interest income 68 106 372 5 (7) – 544
Net interest income on
trading activities ..................... – – 134 –8 692 834
Net trading income56 ................... 68 106 506 5 1 692 1,378
Net income from financial
instruments designated at
fair value ................................. 424 124 2 – – – 550
Gains less losses from
financial investments .............. 11 1 124 1 – – 137
Dividend income ......................... 10 3 1 – – – 14
Net earned insurance premiums . 2,068 551 34 – – – 2,653
Other operating income .............. 265 57 32 2 222 (250) 328
Total operating income ............ 8,304 3,681 1,777 69 216 (250) 13,797
Net insurance claims65 ................ (1,850) (478) (16) – – – (2,344)
Net operating income52 ............. 6,454 3,203 1,761 69 216 (250) 11,453
Loan impairment charges and
other credit risk provisions ..... (1,369) (501) (12) – (1) – (1,883)
Net operating income ............... 5,085 2,702 1,749 69 215 (250) 9,570
Total operating expenses ............ (4,382) (1,835) (700) (49) (539) 250 (7,255)
Operating profit/(loss) .............. 703 867 1,049 20 (324) – 2,315
Share of profit in associates
and joint ventures ................... – – – – – – –
Profit/(loss) before tax .............. 703 867 1,049 20 (324) – 2,315
% % % % % %
Share of HSBC’s profit
before tax ................................ 3.2 4.0 4.8 0.1 (1.5) 10.6
Cost efficiency ratio ................... 67.9 57.3 39.8 71.0 249.5 63.3
Balance sheet data49
US$m US$m US$m US$m US$m US$m
Loans and advances to
customers (net) ....................... 19,025 25,834 11,011 62 6 55,938
Total assets ................................. 39,231 38,410 66,241 1,660 417 (1,070) 144,889
Customer accounts ...................... 28,629 24,050 18,940 7,079 62 78,760