HSBC 2011 Annual Report Download - page 399
Download and view the complete annual report
Please find page 399 of the 2011 HSBC annual report below. You can navigate through the pages in the report by either clicking on the pages listed below, or by using the keyword search tool below to find specific information within the annual report.-
 1
1 -
2
-
3
-
4
-
5
-
6
-
7
-
8
-
9
-
10
-
11
-
12
-
13
-
14
-
15
-
16
-
17
-
18
-
19
-
20
-
21
-
22
-
23
-
24
-
25
-
26
-
27
-
28
-
29
-
30
-
31
-
32
-
33
-
34
-
35
-
36
-
37
-
38
-
39
-
40
-
41
-
42
-
43
-
44
-
45
-
46
-
47
-
48
-
49
-
50
-
51
-
52
-
53
-
54
-
55
-
56
-
57
-
58
-
59
-
60
-
61
-
62
-
63
-
64
-
65
-
66
-
67
-
68
-
69
-
70
-
71
-
72
-
73
-
74
-
75
-
76
-
77
-
78
-
79
-
80
-
81
-
82
-
83
-
84
-
85
-
86
-
87
-
88
-
89
-
90
-
91
-
92
-
93
-
94
-
95
-
96
-
97
-
98
-
99
-
100
-
101
-
102
-
103
-
104
-
105
-
106
-
107
-
108
-
109
-
110
-
111
-
112
-
113
-
114
-
115
-
116
-
117
-
118
-
119
-
120
-
121
-
122
-
123
-
124
-
125
-
126
-
127
-
128
-
129
-
130
-
131
-
132
-
133
-
134
-
135
-
136
-
137
-
138
-
139
-
140
-
141
-
142
-
143
-
144
-
145
-
146
-
147
-
148
-
149
-
150
-
151
-
152
-
153
-
154
-
155
-
156
-
157
-
158
-
159
-
160
-
161
-
162
-
163
-
164
-
165
-
166
-
167
-
168
-
169
-
170
-
171
-
172
-
173
-
174
-
175
-
176
-
177
-
178
-
179
-
180
-
181
-
182
-
183
-
184
-
185
-
186
-
187
-
188
-
189
-
190
-
191
-
192
-
193
-
194
-
195
-
196
-
197
-
198
-
199
-
200
-
201
-
202
-
203
-
204
-
205
-
206
-
207
-
208
-
209
-
210
-
211
-
212
-
213
-
214
-
215
-
216
-
217
-
218
-
219
-
220
-
221
-
222
-
223
-
224
-
225
-
226
-
227
-
228
-
229
-
230
-
231
-
232
-
233
-
234
-
235
-
236
-
237
-
238
-
239
-
240
-
241
-
242
-
243
-
244
-
245
-
246
-
247
-
248
-
249
-
250
-
251
-
252
-
253
-
254
-
255
-
256
-
257
-
258
-
259
-
260
-
261
-
262
-
263
-
264
-
265
-
266
-
267
-
268
-
269
-
270
-
271
-
272
-
273
-
274
-
275
-
276
-
277
-
278
-
279
-
280
-
281
-
282
-
283
-
284
-
285
-
286
-
287
-
288
-
289
-
290
-
291
-
292
-
293
-
294
-
295
-
296
-
297
-
298
-
299
-
300
-
301
-
302
-
303
-
304
-
305
-
306
-
307
-
308
-
309
-
310
-
311
-
312
-
313
-
314
-
315
-
316
-
317
-
318
-
319
-
320
-
321
-
322
-
323
-
324
-
325
-
326
-
327
-
328
-
329
-
330
-
331
-
332
-
333
-
334
-
335
-
336
-
337
-
338
-
339
-
340
-
341
-
342
-
343
-
344
-
345
-
346
-
347
-
348
-
349
-
350
-
351
-
352
-
353
-
354
-
355
-
356
-
357
-
358
-
359
-
360
-
361
-
362
-
363
-
364
-
365
-
366
-
367
-
368
-
369
-
370
-
371
-
372
-
373
-
374
-
375
-
376
-
377
-
378
-
379
-
380
-
381
-
382
-
383
-
384
-
385
-
386
-
387
-
388
-
 389
389 -
 390
390 -
 391
391 -
 392
392 -
 393
393 -
 394
394 -
 395
395 -
 396
396 -
 397
397 -
 398
398 -
 399
399 -
 400
400 -
 401
401 -
 402
402 -
 403
403 -
 404
404 -
 405
405 -
 406
406 -
 407
407 -
 408
408 -
 409
409 -
410
-
411
-
412
-
413
-
414
-
415
-
416
-
417
-
418
-
419
-
420
-
421
-
422
-
423
-
424
-
425
-
426
-
427
-
428
-
429
-
430
-
431
-
432
-
433
-
434
-
435
-
436
-
437
-
438
-
439
-
440
 |
 |

397
Overview Operating & Financial Review Corporate Governance Financial Statements Shareholder Information
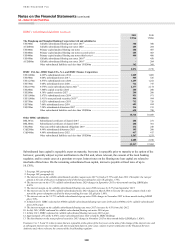
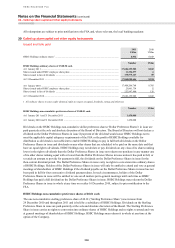
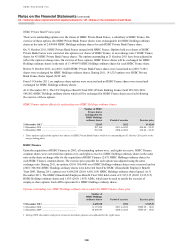
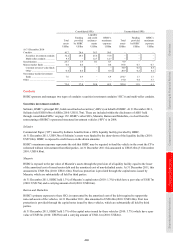
HSBC Bank Bermuda plans
Upon the acquisition of HSBC Bank Bermuda in 2004, all outstanding share options over HSBC Bank Bermuda
shares were converted into options to acquire HSBC Holdings ordinary shares using an exchange ratio calculated by
dividing US$40 (being the consideration paid for each HSBC Bank Bermuda Share) by the average price of HSBC
Holdings ordinary shares over the 5 day period to the completion of the acquisition. The exercise price payable for
each option was adjusted using the same exchange ratio. During 2011, no (2010: 4,781) options over HSBC Holdings
ordinary shares were exercised and no shares were delivered from the HSBC (Bank of Bermuda) Employee Benefit
Trust 2004. During 2011, options over 1,308,126 (2010: 137,888) HSBC Holdings ordinary shares lapsed. At
31 December 2011, the HSBC (Bank of Bermuda) Employee Benefit Trust 2004 held 2,108,830 (2010: 2,108,830)
HSBC Holdings ordinary shares which may be used to satisfy the exercise of employee options.
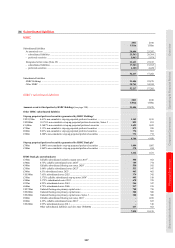
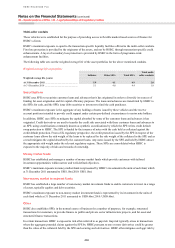
Options outstanding over HSBC Holdings ordinary shares under the HSBC Bank Bermuda share plan
Number of
HSBC Holdings
ordinary shares Period of exercise Exercise price
31 December 2011 .......................................................... 1,030,907 2012 to 2013 US$9.32 – 15.99
31 December 2010 ........................................................... 2,339,033 2011 to 2013 US$9.32 – 15.99
31 December 20091........................................................... 2,481,702 2010 to 2013 US$6.13 – 15.99
1 During 2009, the number and prices of unexercised share options were adjusted for the rights issue.
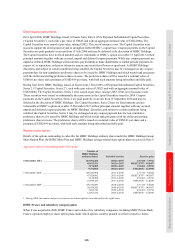
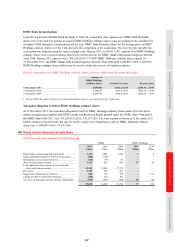
Maximum obligation to deliver HSBC Holdings ordinary shares
At 31 December 2011, the maximum obligation to deliver HSBC Holdings ordinary shares under all of the above
option arrangements, together with GPSP awards and Restricted Shares granted under the HSBC Share Plan and/or
the HSBC Share Plan 2011, was 538,265,410 (2010: 558,187,326). The total number of shares at 31 December 2011
held by employee benefit trusts that may be used to satisfy such obligations to deliver HSBC Holdings ordinary
shares was 31,840,893 (2010: 79,541,700).
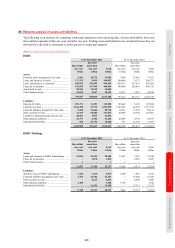
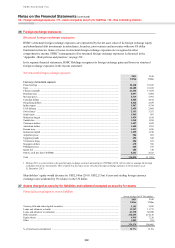
40 Notes on the statement of cash flows
Other non-cash items included in profit before tax
HSBC HSBC Holdings
2011 2010 2009 2011 2010
US$m US$m US$m US$m US$m
Depreciation, amortisation and impairment .................... 3,135 2,801 2,538 1 2
Gains arising from dilution of interests in associates .......... (208) (188) – – –
Revaluations on investment property .............................. (118) (93) 24 – –
Share-based payment expense ......................................... 1,162 812 683 57 28
Loan impairment losses gross of recoveries and
other credit risk provisions .......................................... 13,553 15,059 27,378 – –
Provisions ........................................................................ 2,199 680 669 – –
Impairment of financial investments ............................... 808 105 358 – 113
Charge/(credit) for defined benefit plans ........................ (140) 526 192 – –
Accretion of discounts and amortisation of premiums ... (513) (815) (458) 19 42
19,878 18,887 31,384 77 185