HSBC 2011 Annual Report Download - page 142
Download and view the complete annual report
Please find page 142 of the 2011 HSBC annual report below. You can navigate through the pages in the report by either clicking on the pages listed below, or by using the keyword search tool below to find specific information within the annual report.-
 1
1 -
2
-
3
-
4
-
5
-
6
-
7
-
8
-
9
-
10
-
11
-
12
-
13
-
14
-
15
-
16
-
17
-
18
-
19
-
20
-
21
-
22
-
23
-
24
-
25
-
26
-
27
-
28
-
29
-
30
-
31
-
32
-
33
-
34
-
35
-
36
-
37
-
38
-
39
-
40
-
41
-
42
-
43
-
44
-
45
-
46
-
47
-
48
-
49
-
50
-
51
-
52
-
53
-
54
-
55
-
56
-
57
-
58
-
59
-
60
-
61
-
62
-
63
-
64
-
65
-
66
-
67
-
68
-
69
-
70
-
71
-
72
-
73
-
74
-
75
-
76
-
77
-
78
-
79
-
80
-
81
-
82
-
83
-
84
-
85
-
86
-
87
-
88
-
89
-
90
-
91
-
92
-
93
-
94
-
95
-
96
-
97
-
98
-
99
-
100
-
101
-
102
-
103
-
104
-
105
-
106
-
107
-
108
-
109
-
110
-
111
-
112
-
113
-
114
-
115
-
116
-
117
-
118
-
119
-
120
-
121
-
122
-
123
-
124
-
125
-
126
-
127
-
128
-
129
-
130
-
131
-
 132
132 -
 133
133 -
 134
134 -
 135
135 -
 136
136 -
 137
137 -
 138
138 -
 139
139 -
 140
140 -
 141
141 -
 142
142 -
 143
143 -
 144
144 -
 145
145 -
 146
146 -
 147
147 -
 148
148 -
 149
149 -
 150
150 -
 151
151 -
 152
152 -
153
-
154
-
155
-
156
-
157
-
158
-
159
-
160
-
161
-
162
-
163
-
164
-
165
-
166
-
167
-
168
-
169
-
170
-
171
-
172
-
173
-
174
-
175
-
176
-
177
-
178
-
179
-
180
-
181
-
182
-
183
-
184
-
185
-
186
-
187
-
188
-
189
-
190
-
191
-
192
-
193
-
194
-
195
-
196
-
197
-
198
-
199
-
200
-
201
-
202
-
203
-
204
-
205
-
206
-
207
-
208
-
209
-
210
-
211
-
212
-
213
-
214
-
215
-
216
-
217
-
218
-
219
-
220
-
221
-
222
-
223
-
224
-
225
-
226
-
227
-
228
-
229
-
230
-
231
-
232
-
233
-
234
-
235
-
236
-
237
-
238
-
239
-
240
-
241
-
242
-
243
-
244
-
245
-
246
-
247
-
248
-
249
-
250
-
251
-
252
-
253
-
254
-
255
-
256
-
257
-
258
-
259
-
260
-
261
-
262
-
263
-
264
-
265
-
266
-
267
-
268
-
269
-
270
-
271
-
272
-
273
-
274
-
275
-
276
-
277
-
278
-
279
-
280
-
281
-
282
-
283
-
284
-
285
-
286
-
287
-
288
-
289
-
290
-
291
-
292
-
293
-
294
-
295
-
296
-
297
-
298
-
299
-
300
-
301
-
302
-
303
-
304
-
305
-
306
-
307
-
308
-
309
-
310
-
311
-
312
-
313
-
314
-
315
-
316
-
317
-
318
-
319
-
320
-
321
-
322
-
323
-
324
-
325
-
326
-
327
-
328
-
329
-
330
-
331
-
332
-
333
-
334
-
335
-
336
-
337
-
338
-
339
-
340
-
341
-
342
-
343
-
344
-
345
-
346
-
347
-
348
-
349
-
350
-
351
-
352
-
353
-
354
-
355
-
356
-
357
-
358
-
359
-
360
-
361
-
362
-
363
-
364
-
365
-
366
-
367
-
368
-
369
-
370
-
371
-
372
-
373
-
374
-
375
-
376
-
377
-
378
-
379
-
380
-
381
-
382
-
383
-
384
-
385
-
386
-
387
-
388
-
389
-
390
-
391
-
392
-
393
-
394
-
395
-
396
-
397
-
398
-
399
-
400
-
401
-
402
-
403
-
404
-
405
-
406
-
407
-
408
-
409
-
410
-
411
-
412
-
413
-
414
-
415
-
416
-
417
-
418
-
419
-
420
-
421
-
422
-
423
-
424
-
425
-
426
-
427
-
428
-
429
-
430
-
431
-
432
-
433
-
434
-
435
-
436
-
437
-
438
-
439
-
440
 |
 |
HSBC HOLDINGS PLC
Report of the Directors: Operating and Financial Review (continued)
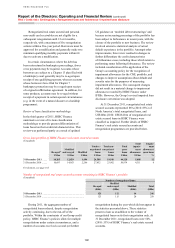
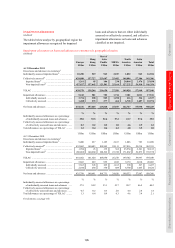
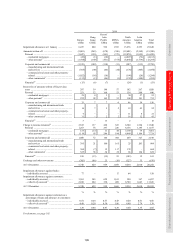
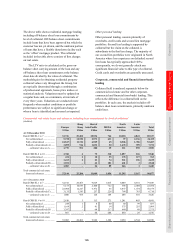
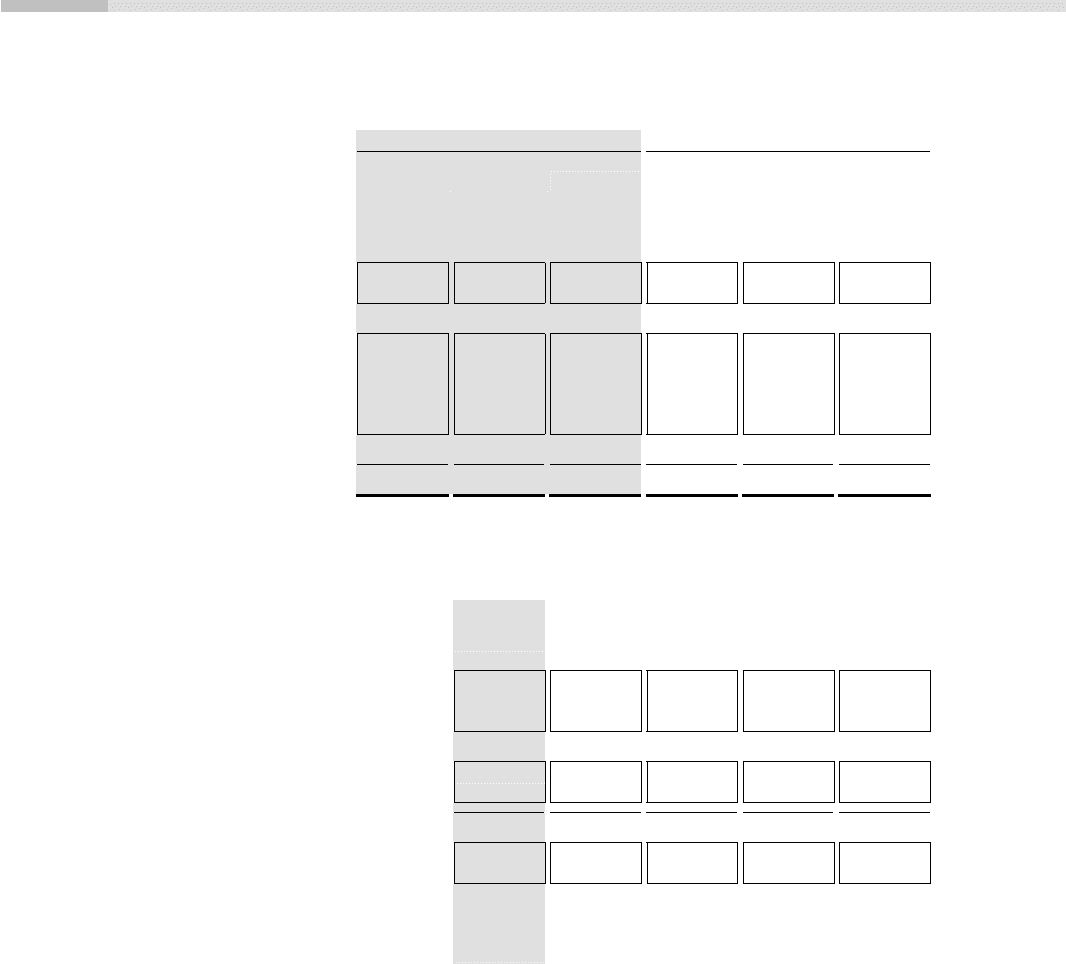
Risk > Credit risk > Impairment of loans and advances / Impairment charge
140
Impairment charge
Individually and collectively assessed impairment charge to the income statement by industry sector
(Unaudited)
2011 2010
Individually
assessed
US$m
Collectively
assessed
US$m
Total
US$m
Individually
assessed
US$m
Collectively
assessed
US$m
Total
US$m
Banks .................................................................. (16) – (16) 12 – 12
Personal ............................................................... 141 9,177 9,318 180 11,007 11,187
Residential mortgages .................................... 104 3,999 4,103 137 3,324 3,461
Other personal5 ............................................... 37 5,178 5,215 43 7,683 7,726
Corporate and commercial ................................. 1,703 411 2,114 2,190 8 2,198
Manufacturing and international trade
and services ................................................ 572 329 901 997 (88) 909
Commercial real estate and other
property-related .......................................... 768 (4) 764 680 (20) 660
Other commercial7 .......................................... 363 86 449 513 116 629
Financial ............................................................. 87 2 89 243 (92) 151
Total charge to income statement ....................... 1,915 9,590 11,505 2,625 10,923 13,548
For footnote, see page 185.
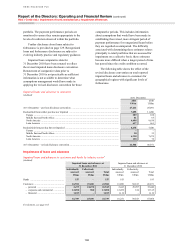
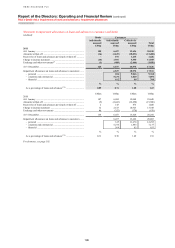
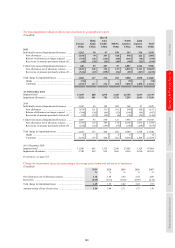
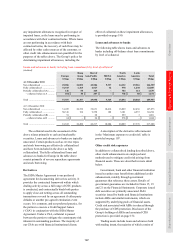
Net loan impairment charge to the income statement
(Unaudited)
2011 2010 2009 2008 2007
US$m US$m US$m US$m US$m
Individually assessed impairment allowances ............................ 1,915 2,625 4,458 2,064 796
New allowances ....................................................................... 2,904 3,617 5,173 2,742 1,533
Release of allowances no longer required .............................. (798) (847) (581) (565) (608)
Recoveries of amounts previously written off ........................ (191) (145) (134) (113) (129)
Collectively assessed impairment allowances ............................ 9,590 10,923 20,484 22,067 16,381
New allowances net of allowance releases ............................. 10,825 11,798 21,240 22,788 17,257
Recoveries of amounts previously written off ........................ (1,235) (875) (756) (721) (876)
Total charge for impairment losses ............................................. 11,505 13,548 24,942 24,131 17,177
Banks ...................................................................................... (16) 12 70 54 –
Customers ............................................................................... 11,521 13,536 24,872 24,077 17,177
At 31 December
Impaired loans8 ............................................................................ 41,739 47,064 30,845 25,422 19,594
Impairment allowances ................................................................ 17,636 20,241 25,649 23,972 19,212
For footnote, see page 185.