HSBC 2011 Annual Report Download - page 81
Download and view the complete annual report
Please find page 81 of the 2011 HSBC annual report below. You can navigate through the pages in the report by either clicking on the pages listed below, or by using the keyword search tool below to find specific information within the annual report.-
 1
1 -
2
-
3
-
4
-
5
-
6
-
7
-
8
-
9
-
10
-
11
-
12
-
13
-
14
-
15
-
16
-
17
-
18
-
19
-
20
-
21
-
22
-
23
-
24
-
25
-
26
-
27
-
28
-
29
-
30
-
31
-
32
-
33
-
34
-
35
-
36
-
37
-
38
-
39
-
40
-
41
-
42
-
43
-
44
-
45
-
46
-
47
-
48
-
49
-
50
-
51
-
52
-
53
-
54
-
55
-
56
-
57
-
58
-
59
-
60
-
61
-
62
-
63
-
64
-
65
-
66
-
67
-
68
-
69
-
70
-
 71
71 -
 72
72 -
 73
73 -
 74
74 -
 75
75 -
 76
76 -
 77
77 -
 78
78 -
 79
79 -
 80
80 -
 81
81 -
 82
82 -
 83
83 -
 84
84 -
 85
85 -
 86
86 -
 87
87 -
 88
88 -
 89
89 -
 90
90 -
 91
91 -
92
-
93
-
94
-
95
-
96
-
97
-
98
-
99
-
100
-
101
-
102
-
103
-
104
-
105
-
106
-
107
-
108
-
109
-
110
-
111
-
112
-
113
-
114
-
115
-
116
-
117
-
118
-
119
-
120
-
121
-
122
-
123
-
124
-
125
-
126
-
127
-
128
-
129
-
130
-
131
-
132
-
133
-
134
-
135
-
136
-
137
-
138
-
139
-
140
-
141
-
142
-
143
-
144
-
145
-
146
-
147
-
148
-
149
-
150
-
151
-
152
-
153
-
154
-
155
-
156
-
157
-
158
-
159
-
160
-
161
-
162
-
163
-
164
-
165
-
166
-
167
-
168
-
169
-
170
-
171
-
172
-
173
-
174
-
175
-
176
-
177
-
178
-
179
-
180
-
181
-
182
-
183
-
184
-
185
-
186
-
187
-
188
-
189
-
190
-
191
-
192
-
193
-
194
-
195
-
196
-
197
-
198
-
199
-
200
-
201
-
202
-
203
-
204
-
205
-
206
-
207
-
208
-
209
-
210
-
211
-
212
-
213
-
214
-
215
-
216
-
217
-
218
-
219
-
220
-
221
-
222
-
223
-
224
-
225
-
226
-
227
-
228
-
229
-
230
-
231
-
232
-
233
-
234
-
235
-
236
-
237
-
238
-
239
-
240
-
241
-
242
-
243
-
244
-
245
-
246
-
247
-
248
-
249
-
250
-
251
-
252
-
253
-
254
-
255
-
256
-
257
-
258
-
259
-
260
-
261
-
262
-
263
-
264
-
265
-
266
-
267
-
268
-
269
-
270
-
271
-
272
-
273
-
274
-
275
-
276
-
277
-
278
-
279
-
280
-
281
-
282
-
283
-
284
-
285
-
286
-
287
-
288
-
289
-
290
-
291
-
292
-
293
-
294
-
295
-
296
-
297
-
298
-
299
-
300
-
301
-
302
-
303
-
304
-
305
-
306
-
307
-
308
-
309
-
310
-
311
-
312
-
313
-
314
-
315
-
316
-
317
-
318
-
319
-
320
-
321
-
322
-
323
-
324
-
325
-
326
-
327
-
328
-
329
-
330
-
331
-
332
-
333
-
334
-
335
-
336
-
337
-
338
-
339
-
340
-
341
-
342
-
343
-
344
-
345
-
346
-
347
-
348
-
349
-
350
-
351
-
352
-
353
-
354
-
355
-
356
-
357
-
358
-
359
-
360
-
361
-
362
-
363
-
364
-
365
-
366
-
367
-
368
-
369
-
370
-
371
-
372
-
373
-
374
-
375
-
376
-
377
-
378
-
379
-
380
-
381
-
382
-
383
-
384
-
385
-
386
-
387
-
388
-
389
-
390
-
391
-
392
-
393
-
394
-
395
-
396
-
397
-
398
-
399
-
400
-
401
-
402
-
403
-
404
-
405
-
406
-
407
-
408
-
409
-
410
-
411
-
412
-
413
-
414
-
415
-
416
-
417
-
418
-
419
-
420
-
421
-
422
-
423
-
424
-
425
-
426
-
427
-
428
-
429
-
430
-
431
-
432
-
433
-
434
-
435
-
436
-
437
-
438
-
439
-
440
 |
 |

79
Overview Operating & Financial Review Corporate Governance Financial Statements Shareholder Information
Greater collaboration between CMB and
GB&M benefited both businesses with a significant
increase in GB&M-related revenues from 2010.
In GB&M, we continued to focus on our key
clients and used our global expertise and reach both
to complete a number of cross-border deals for
regional clients and provide risk management
solutions tailored for customer needs, including
Islamic products. We won a number of awards,
including ‘Best for Middle Eastern Currencies’ in
the Euromoney FX survey and ‘Best Risk Advisor in
Middle East’ from Euromoney. We continued to be
recognised as a leading provider of Islamic financial
services and we were awarded ‘Best Islamic
Investment Bank, Middle East’ and ‘Sukuk House of
the Year’ from The Asset Magazine Triple A Islamic
Finance Awards.
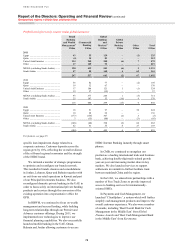
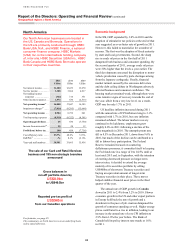
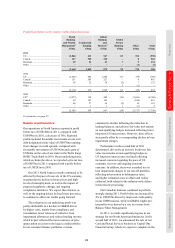
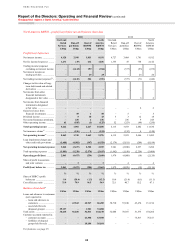
Net interest income rose by 6%, driven by
strong growth in average trade lending balances in
the second half of 2010 and throughout 2011 in
CMB as we leveraged opportunities to support
global and intra-regional trade flows. GB&M also
benefited from the restructuring of a large customer
facility along with improved spreads on investment
portfolios. This was partly offset by a reduction in
spreads in CMB as we priced competitively to drive
volume growth. In addition, average lending
balances declined in RBWM as unsecured lending
portfolios continued to be managed down and
replaced by higher quality lending resulting in an
overall improvement in the credit quality of the
portfolio. Central bank regulations limiting interest
rates on certain products in Qatar also contributed to
lower net interest income.
Net fee income decreased by 7%, despite higher
trade volumes in CMB, as lower institutional equity
activity in GB&M reflected the challenging political
environment. In addition, net fee income in RBWM
decreased due to a decline in the number of credit
cards in issue as certain portfolios were managed
down, along with lower late fees as a result of an
improvement in delinquency rates.
Trading income increased by 31%, mainly in
Rates in GB&M due to an increase in government
bond trading along with a net release of credit
valuation adjustments driven by movements in
exchange rates and an improvement in counterparty
risk. A greater focus on sales of GB&M products to
CMB customers, notably foreign exchange, also
contributed to the rise in trading income.
Loan impairment charges and other credit risk
provisions decreased markedly as the significant
loan impairment charges which resulted from
restructuring activity for a small number of large
GB&M customers in 2010 did not recur. In addition,
lower loan impairment charges in RBWM reflected a
significant improvement in delinquency rates, which
resulted from a repositioning of the loan book
towards higher quality lending as we continued to
manage down higher risk unsecured lending,
together with strengthened collection practices. Our
lending portfolios were not significantly adversely
affected by political instability in the region,
although uncertainties remain in certain of these
markets.
Operating expenses increased by 8% due
to an increase in staff costs as we enhanced the
employee base, and to a lesser extent, in line with
inflation. Strategic programmes, including
de-layering our management structure, streamlining
our business processes and implementing the ‘hub
and spoke’ model to drive future sustainable cost
savings, resulted in lower staff numbers than last
year. This resulted in restructuring costs of US$31m.
Marketing costs also rose as we increased
investment in the promotion of the HSBC brand.
Profit from associates and joint ventures
increased by 81%, mainly from The Saudi British
Bank, driven by a decline in loan impairment
charges as the credit environment in Saudi Arabia
improved, along with cost control.