HSBC 2011 Annual Report Download - page 114
Download and view the complete annual report
Please find page 114 of the 2011 HSBC annual report below. You can navigate through the pages in the report by either clicking on the pages listed below, or by using the keyword search tool below to find specific information within the annual report.-
 1
1 -
2
-
3
-
4
-
5
-
6
-
7
-
8
-
9
-
10
-
11
-
12
-
13
-
14
-
15
-
16
-
17
-
18
-
19
-
20
-
21
-
22
-
23
-
24
-
25
-
26
-
27
-
28
-
29
-
30
-
31
-
32
-
33
-
34
-
35
-
36
-
37
-
38
-
39
-
40
-
41
-
42
-
43
-
44
-
45
-
46
-
47
-
48
-
49
-
50
-
51
-
52
-
53
-
54
-
55
-
56
-
57
-
58
-
59
-
60
-
61
-
62
-
63
-
64
-
65
-
66
-
67
-
68
-
69
-
70
-
71
-
72
-
73
-
74
-
75
-
76
-
77
-
78
-
79
-
80
-
81
-
82
-
83
-
84
-
85
-
86
-
87
-
88
-
89
-
90
-
91
-
92
-
93
-
94
-
95
-
96
-
97
-
98
-
99
-
100
-
101
-
102
-
103
-
 104
104 -
 105
105 -
 106
106 -
 107
107 -
 108
108 -
 109
109 -
 110
110 -
 111
111 -
 112
112 -
 113
113 -
 114
114 -
 115
115 -
 116
116 -
 117
117 -
 118
118 -
 119
119 -
 120
120 -
 121
121 -
 122
122 -
 123
123 -
 124
124 -
125
-
126
-
127
-
128
-
129
-
130
-
131
-
132
-
133
-
134
-
135
-
136
-
137
-
138
-
139
-
140
-
141
-
142
-
143
-
144
-
145
-
146
-
147
-
148
-
149
-
150
-
151
-
152
-
153
-
154
-
155
-
156
-
157
-
158
-
159
-
160
-
161
-
162
-
163
-
164
-
165
-
166
-
167
-
168
-
169
-
170
-
171
-
172
-
173
-
174
-
175
-
176
-
177
-
178
-
179
-
180
-
181
-
182
-
183
-
184
-
185
-
186
-
187
-
188
-
189
-
190
-
191
-
192
-
193
-
194
-
195
-
196
-
197
-
198
-
199
-
200
-
201
-
202
-
203
-
204
-
205
-
206
-
207
-
208
-
209
-
210
-
211
-
212
-
213
-
214
-
215
-
216
-
217
-
218
-
219
-
220
-
221
-
222
-
223
-
224
-
225
-
226
-
227
-
228
-
229
-
230
-
231
-
232
-
233
-
234
-
235
-
236
-
237
-
238
-
239
-
240
-
241
-
242
-
243
-
244
-
245
-
246
-
247
-
248
-
249
-
250
-
251
-
252
-
253
-
254
-
255
-
256
-
257
-
258
-
259
-
260
-
261
-
262
-
263
-
264
-
265
-
266
-
267
-
268
-
269
-
270
-
271
-
272
-
273
-
274
-
275
-
276
-
277
-
278
-
279
-
280
-
281
-
282
-
283
-
284
-
285
-
286
-
287
-
288
-
289
-
290
-
291
-
292
-
293
-
294
-
295
-
296
-
297
-
298
-
299
-
300
-
301
-
302
-
303
-
304
-
305
-
306
-
307
-
308
-
309
-
310
-
311
-
312
-
313
-
314
-
315
-
316
-
317
-
318
-
319
-
320
-
321
-
322
-
323
-
324
-
325
-
326
-
327
-
328
-
329
-
330
-
331
-
332
-
333
-
334
-
335
-
336
-
337
-
338
-
339
-
340
-
341
-
342
-
343
-
344
-
345
-
346
-
347
-
348
-
349
-
350
-
351
-
352
-
353
-
354
-
355
-
356
-
357
-
358
-
359
-
360
-
361
-
362
-
363
-
364
-
365
-
366
-
367
-
368
-
369
-
370
-
371
-
372
-
373
-
374
-
375
-
376
-
377
-
378
-
379
-
380
-
381
-
382
-
383
-
384
-
385
-
386
-
387
-
388
-
389
-
390
-
391
-
392
-
393
-
394
-
395
-
396
-
397
-
398
-
399
-
400
-
401
-
402
-
403
-
404
-
405
-
406
-
407
-
408
-
409
-
410
-
411
-
412
-
413
-
414
-
415
-
416
-
417
-
418
-
419
-
420
-
421
-
422
-
423
-
424
-
425
-
426
-
427
-
428
-
429
-
430
-
431
-
432
-
433
-
434
-
435
-
436
-
437
-
438
-
439
-
440
 |
 |

HSBC HOLDINGS PLC
Report of the Directors: Operating and Financial Review (continued)
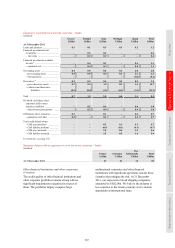
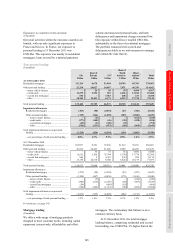
Risk > Credit risk > Credit exposure / Areas of special interest > Wholesale lending
11 2
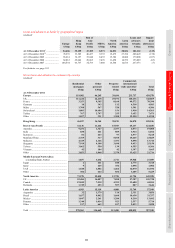
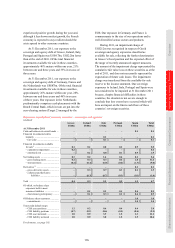
Gross loans and advances to customers by country (continued)
Residential
mortgages
US$m
Other
personal
US$m
Property-
related
US$m
Commercial,
international
trade and other
US$m
Total
US$m
At 31 December 2010
Europe ............................................................. 111,618 50,099 37,030 242,715 441,462
UK ................................................................... 103,037 25,636 26,002 165,283 319,958
France ............................................................. 3,749 9,550 8,737 56,613 78,649
Germany ......................................................... 11 356 79 4,015 4,461
Malta ............................................................... 1,656 599 563 1,643 4,461
Switzerland ..................................................... 1,358 10,708 114 1,837 14,017
Turkey ............................................................. 809 2,817 210 2,783 6,619
Other ............................................................... 998 433 1,325 10,541 13,297
Hong Kong ..................................................... 42,488 14,820 34,910 49,102 141,320
Rest of Asia-Pacific ........................................ 28,724 11,460 14,158 55,348 109,690
Australia .......................................................... 8,405 1,267 2,346 4,867 16,885
India ................................................................ 920 526 680 4,583 6,709
Indonesia ......................................................... 74 531 115 3,374 4,094
Mainland China .............................................. 2,046 310 3,836 12,932 19,124
Malaysia .......................................................... 3,833 2,053 1,361 4,845 12,092
Singapore ........................................................ 6,571 3,661 3,262 7,846 21,340
Taiwan ............................................................ 3,002 527 135 2,832 6,496
Vietnam ........................................................... 35 162 59 1,255 1,511
Other ............................................................... 3,838 2,423 2,364 12,814 21,439
Middle East and North Africa
(excluding Saudi Arabia) ........................... 1,751 3,620 2,870 18,037 26,278
Egypt ............................................................... 3 396 111 2,484 2,994
Qatar ............................................................... 8 491 404 918 1,821
UAE ................................................................ 1,477 2,099 1,359 11,043 15,978
Other ............................................................... 263 634 996 3,592 5,485
North America ................................................ 78,842 60,275 13,877 46,708 199,702
US ................................................................... 57,630 51,686 8,269 31,496 149,081
Canada ............................................................ 19,505 8,070 5,079 14,711 47,365
Bermuda .......................................................... 1,707 519 529 501 3,256
Latin America ................................................. 5,258 16,365 3,873 34,501 59,997
Argentina ........................................................ 30 918 103 2,172 3,223
Brazil ............................................................... 1,111 10,979 1,816 17,093 30,999
Mexico ............................................................ 2,097 2,365 1,146 8,622 14,230
Panama ............................................................ 1,155 982 489 3,794 6,420
Other ............................................................... 865 1,121 319 2,820 5,125
Total ................................................................ 268,681 156,639 106,718 446,411 978,449
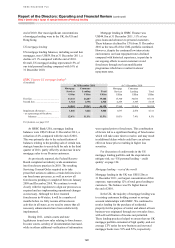
Areas of special interest
Wholesale lending
(Unaudited)
Wholesale lending covers the range of credit
facilities granted to sovereign borrowers, banks,
non-bank financial institutions, corporate entities
and commercial borrowers. Our wholesale
portfolios are well diversified across geographical
and industry sectors, with certain exposures subject
to specific portfolio controls.
During the year, we continued to reduce our
sovereign and financial institution counterparty
credit risk positions in peripheral eurozone
countries. We also reduced our exposure to risk
from financial institution counterparty positions
across the broader eurozone and from specific
financial institutions in other countries. This
process was particularly focused on our surplus
liquidity, which resulted in significant placements
directly with central banks in the most highly rated
countries.
We actively sought to identify those
counterparties domiciled in core European
countries that had exposures to sovereigns and/or
banks in peripheral eurozone countries of sufficient
size to threaten their on-going viability in the event
of an unfavourable conclusion to the current crisis.
This was undertaken through the analysis of
publicly available information, reviews of external
analyst reports and meetings with the counterparties’