HSBC 2011 Annual Report Download - page 79
Download and view the complete annual report
Please find page 79 of the 2011 HSBC annual report below. You can navigate through the pages in the report by either clicking on the pages listed below, or by using the keyword search tool below to find specific information within the annual report.-
 1
1 -
2
-
3
-
4
-
5
-
6
-
7
-
8
-
9
-
10
-
11
-
12
-
13
-
14
-
15
-
16
-
17
-
18
-
19
-
20
-
21
-
22
-
23
-
24
-
25
-
26
-
27
-
28
-
29
-
30
-
31
-
32
-
33
-
34
-
35
-
36
-
37
-
38
-
39
-
40
-
41
-
42
-
43
-
44
-
45
-
46
-
47
-
48
-
49
-
50
-
51
-
52
-
53
-
54
-
55
-
56
-
57
-
58
-
59
-
60
-
61
-
62
-
63
-
64
-
65
-
66
-
67
-
68
-
 69
69 -
 70
70 -
 71
71 -
 72
72 -
 73
73 -
 74
74 -
 75
75 -
 76
76 -
 77
77 -
 78
78 -
 79
79 -
 80
80 -
 81
81 -
 82
82 -
 83
83 -
 84
84 -
 85
85 -
 86
86 -
 87
87 -
 88
88 -
 89
89 -
90
-
91
-
92
-
93
-
94
-
95
-
96
-
97
-
98
-
99
-
100
-
101
-
102
-
103
-
104
-
105
-
106
-
107
-
108
-
109
-
110
-
111
-
112
-
113
-
114
-
115
-
116
-
117
-
118
-
119
-
120
-
121
-
122
-
123
-
124
-
125
-
126
-
127
-
128
-
129
-
130
-
131
-
132
-
133
-
134
-
135
-
136
-
137
-
138
-
139
-
140
-
141
-
142
-
143
-
144
-
145
-
146
-
147
-
148
-
149
-
150
-
151
-
152
-
153
-
154
-
155
-
156
-
157
-
158
-
159
-
160
-
161
-
162
-
163
-
164
-
165
-
166
-
167
-
168
-
169
-
170
-
171
-
172
-
173
-
174
-
175
-
176
-
177
-
178
-
179
-
180
-
181
-
182
-
183
-
184
-
185
-
186
-
187
-
188
-
189
-
190
-
191
-
192
-
193
-
194
-
195
-
196
-
197
-
198
-
199
-
200
-
201
-
202
-
203
-
204
-
205
-
206
-
207
-
208
-
209
-
210
-
211
-
212
-
213
-
214
-
215
-
216
-
217
-
218
-
219
-
220
-
221
-
222
-
223
-
224
-
225
-
226
-
227
-
228
-
229
-
230
-
231
-
232
-
233
-
234
-
235
-
236
-
237
-
238
-
239
-
240
-
241
-
242
-
243
-
244
-
245
-
246
-
247
-
248
-
249
-
250
-
251
-
252
-
253
-
254
-
255
-
256
-
257
-
258
-
259
-
260
-
261
-
262
-
263
-
264
-
265
-
266
-
267
-
268
-
269
-
270
-
271
-
272
-
273
-
274
-
275
-
276
-
277
-
278
-
279
-
280
-
281
-
282
-
283
-
284
-
285
-
286
-
287
-
288
-
289
-
290
-
291
-
292
-
293
-
294
-
295
-
296
-
297
-
298
-
299
-
300
-
301
-
302
-
303
-
304
-
305
-
306
-
307
-
308
-
309
-
310
-
311
-
312
-
313
-
314
-
315
-
316
-
317
-
318
-
319
-
320
-
321
-
322
-
323
-
324
-
325
-
326
-
327
-
328
-
329
-
330
-
331
-
332
-
333
-
334
-
335
-
336
-
337
-
338
-
339
-
340
-
341
-
342
-
343
-
344
-
345
-
346
-
347
-
348
-
349
-
350
-
351
-
352
-
353
-
354
-
355
-
356
-
357
-
358
-
359
-
360
-
361
-
362
-
363
-
364
-
365
-
366
-
367
-
368
-
369
-
370
-
371
-
372
-
373
-
374
-
375
-
376
-
377
-
378
-
379
-
380
-
381
-
382
-
383
-
384
-
385
-
386
-
387
-
388
-
389
-
390
-
391
-
392
-
393
-
394
-
395
-
396
-
397
-
398
-
399
-
400
-
401
-
402
-
403
-
404
-
405
-
406
-
407
-
408
-
409
-
410
-
411
-
412
-
413
-
414
-
415
-
416
-
417
-
418
-
419
-
420
-
421
-
422
-
423
-
424
-
425
-
426
-
427
-
428
-
429
-
430
-
431
-
432
-
433
-
434
-
435
-
436
-
437
-
438
-
439
-
440
 |
 |

77
Overview Operating & Financial Review Corporate Governance Financial Statements Shareholder Information
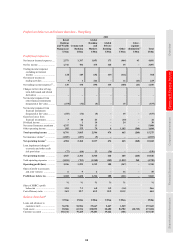
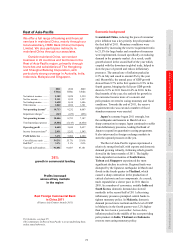
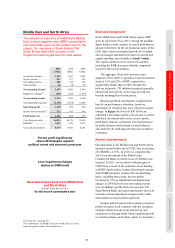
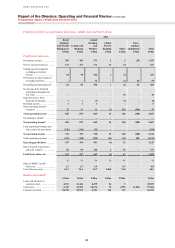
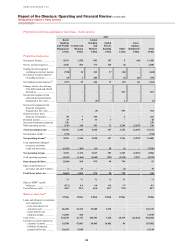
Middle East and North Africa
The network of branches of HSBC Bank Middle
East Limited, together with HSBC’s subsidiaries
and associates, gives us the widest reach in the
region. Our associate in Saudi Arabia, The
Saudi British Bank (40% owned), is the
Kingdom’s sixth largest bank by total assets.
2011 2010 2009
US$m US$m US$m
Net interest income .......... 1,432 1,367 1,485
Net fee income ................. 627 677 625
Net trading income .......... 482 370 394
Other income ................... 66 (4) 90
Net operating income52 .. 2,607 2,410 2,594
Impairment charges53 ....... (293) (627) (1,334)
Net operating income .... 2,314 1,783 1,260
Total operating expenses .. (1,159) (1,078) (1,001)
Operating profit ............. 1,155 705 259
Income from associates54 .. 337 187 196
Profit before tax ............. 1,492 892 455
Cost efficiency ratio ........ 44.5% 44.7% 38.6%
RoRWA55 ......................... 2.6% 1.6% 0.8%
Year-end staff numbers ... 8,373 8,676 8,281
Pre-tax profit significantly
above 2010 despite regional
political unrest and economic pressures
Loan impairment charges
decline to 2008 levels
Best trade finance bank in the Middle East
and North Africa
(Global Trade Review 2011)
for the fourth consecutive year
For footnotes, see page 95.
The commentary on Middle East and North Africa is on an
underlying basis unless stated otherwise.
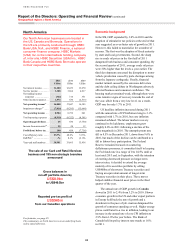
Economic background
In the Middle East and North Africa region, GDP
grew by more than 5% in 2011, though the headline
figure masks a wide variance in overall performance
and growth drivers. In the oil producing states of the
Gulf, high oil prices prompted growth in oil output
and encouraged substantial increases in current and
capital spending, most notably in Saudi Arabia.
The export-oriented service sectors of countries
including the UAE also grew robustly, supported
in part by firm Asian demand.
The aggregate fiscal and current account
surpluses of the Gulf Co-operation Council members
stood at 15% and 25% of GDP, respectively,
significantly higher than in 2010. Despite the
pick-up in growth, CPI inflation remained generally
muted with slow private sector wage growth and
broadly unchanged real estate prices.
Regional political uncertainties weighed more
heavily on performance elsewhere, however,
particularly in countries that were subject to regime
change. In Egypt, the level of GDP fell by an
estimated 6 percentage points year-on-year as unrest
held back investment and service sector exports,
particularly tourism, contracted. Increased pressure
on public finances and external account balances
also added to the challenges for the post-revolution
economies.
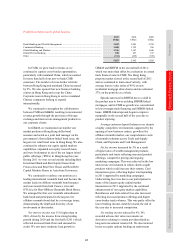
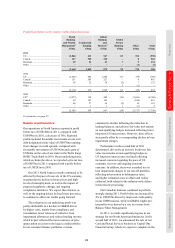
Review of performance
Our operations in the Middle East and North Africa
reported a profit before tax of US$1.5bn, an increase
of US$600m, or 67%. In 2010, we completed the
sale of our investment in the British Arab
Commercial Bank on which a loss of US$42m was
incurred. In 2011, we recorded a dilution gain of
US$27m as a result of the reduction of our holding
in HSBC Saudi Arabia Limited following its merger
with SABB Securities Limited. On an underlying
basis, excluding these items, pre-tax profits
increased by 57% as significant loan impairment
charges in 2010 did not recur and trading income
rose. In addition, profits from our associate, The
Saudi British Bank, increased significantly driven by
a decline in loan impairment charges as the credit
environment in Saudi Arabia improved.
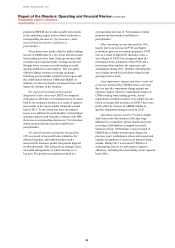
Despite political unrest and economic pressures,
profits increased in all countries with the exception
of Qatar, which was adversely affected by new
regulations on foreign banks which curtailed growth
in certain products, and Jordan, where we incurred a