HSBC 2011 Annual Report Download - page 369
Download and view the complete annual report
Please find page 369 of the 2011 HSBC annual report below. You can navigate through the pages in the report by either clicking on the pages listed below, or by using the keyword search tool below to find specific information within the annual report.-
 1
1 -
2
-
3
-
4
-
5
-
6
-
7
-
8
-
9
-
10
-
11
-
12
-
13
-
14
-
15
-
16
-
17
-
18
-
19
-
20
-
21
-
22
-
23
-
24
-
25
-
26
-
27
-
28
-
29
-
30
-
31
-
32
-
33
-
34
-
35
-
36
-
37
-
38
-
39
-
40
-
41
-
42
-
43
-
44
-
45
-
46
-
47
-
48
-
49
-
50
-
51
-
52
-
53
-
54
-
55
-
56
-
57
-
58
-
59
-
60
-
61
-
62
-
63
-
64
-
65
-
66
-
67
-
68
-
69
-
70
-
71
-
72
-
73
-
74
-
75
-
76
-
77
-
78
-
79
-
80
-
81
-
82
-
83
-
84
-
85
-
86
-
87
-
88
-
89
-
90
-
91
-
92
-
93
-
94
-
95
-
96
-
97
-
98
-
99
-
100
-
101
-
102
-
103
-
104
-
105
-
106
-
107
-
108
-
109
-
110
-
111
-
112
-
113
-
114
-
115
-
116
-
117
-
118
-
119
-
120
-
121
-
122
-
123
-
124
-
125
-
126
-
127
-
128
-
129
-
130
-
131
-
132
-
133
-
134
-
135
-
136
-
137
-
138
-
139
-
140
-
141
-
142
-
143
-
144
-
145
-
146
-
147
-
148
-
149
-
150
-
151
-
152
-
153
-
154
-
155
-
156
-
157
-
158
-
159
-
160
-
161
-
162
-
163
-
164
-
165
-
166
-
167
-
168
-
169
-
170
-
171
-
172
-
173
-
174
-
175
-
176
-
177
-
178
-
179
-
180
-
181
-
182
-
183
-
184
-
185
-
186
-
187
-
188
-
189
-
190
-
191
-
192
-
193
-
194
-
195
-
196
-
197
-
198
-
199
-
200
-
201
-
202
-
203
-
204
-
205
-
206
-
207
-
208
-
209
-
210
-
211
-
212
-
213
-
214
-
215
-
216
-
217
-
218
-
219
-
220
-
221
-
222
-
223
-
224
-
225
-
226
-
227
-
228
-
229
-
230
-
231
-
232
-
233
-
234
-
235
-
236
-
237
-
238
-
239
-
240
-
241
-
242
-
243
-
244
-
245
-
246
-
247
-
248
-
249
-
250
-
251
-
252
-
253
-
254
-
255
-
256
-
257
-
258
-
259
-
260
-
261
-
262
-
263
-
264
-
265
-
266
-
267
-
268
-
269
-
270
-
271
-
272
-
273
-
274
-
275
-
276
-
277
-
278
-
279
-
280
-
281
-
282
-
283
-
284
-
285
-
286
-
287
-
288
-
289
-
290
-
291
-
292
-
293
-
294
-
295
-
296
-
297
-
298
-
299
-
300
-
301
-
302
-
303
-
304
-
305
-
306
-
307
-
308
-
309
-
310
-
311
-
312
-
313
-
314
-
315
-
316
-
317
-
318
-
319
-
320
-
321
-
322
-
323
-
324
-
325
-
326
-
327
-
328
-
329
-
330
-
331
-
332
-
333
-
334
-
335
-
336
-
337
-
338
-
339
-
340
-
341
-
342
-
343
-
344
-
345
-
346
-
347
-
348
-
349
-
350
-
351
-
352
-
353
-
354
-
355
-
356
-
357
-
358
-
 359
359 -
 360
360 -
 361
361 -
 362
362 -
 363
363 -
 364
364 -
 365
365 -
 366
366 -
 367
367 -
 368
368 -
 369
369 -
 370
370 -
 371
371 -
 372
372 -
 373
373 -
 374
374 -
 375
375 -
 376
376 -
 377
377 -
 378
378 -
 379
379 -
380
-
381
-
382
-
383
-
384
-
385
-
386
-
387
-
388
-
389
-
390
-
391
-
392
-
393
-
394
-
395
-
396
-
397
-
398
-
399
-
400
-
401
-
402
-
403
-
404
-
405
-
406
-
407
-
408
-
409
-
410
-
411
-
412
-
413
-
414
-
415
-
416
-
417
-
418
-
419
-
420
-
421
-
422
-
423
-
424
-
425
-
426
-
427
-
428
-
429
-
430
-
431
-
432
-
433
-
434
-
435
-
436
-
437
-
438
-
439
-
440
 |
 |
367
Overview Operating & Financial Review Corporate Governance Financial Statements Shareholder Information
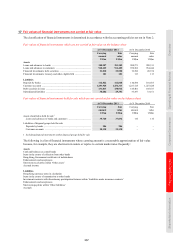
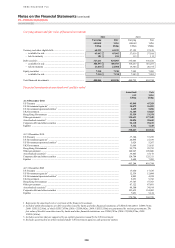
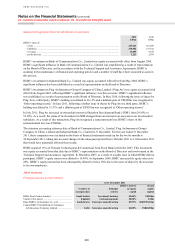
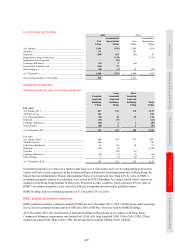
Financial investments listed on a recognised exchange and unlisted
Treasury
and other
eligible bills
available
for sale
Treasury
and other
eligible bills
held to
maturity
Debt
securities
available
for sale
Debt
securities
held to
maturity
Equity
securities
available
for sale
Total
US$m US$m US$m US$m US$m US$m
Carrying amount at 31 December 2011
Listed on a recognised exchange1 ...................... 4,077 – 121,303 4,370 535 130,285
Unlisted2 ............................................................. 60,965 181 185,290 16,648 6,675 269,759
65,042 181 306,593 21,018 7,210 400,044
Carrying amount at 31 December 2010
Listed on a recognised exchange1 ...................... 1,400 – 138,374 4,182 851 144,807
Unlisted2 ............................................................. 55,616 113 177,883 15,204 7,132 255,948
57,016 113 316,257 19,386 7,983 400,755
1 The fair value of listed held-to-maturity debt securities as at 31 December 2011 was US$4,641m (2010: US$4,332m). Included within
listed investments were US$3,544m (2010: US$1,902m) of investments listed in Hong Kong.
2 Unlisted treasury and other eligible bills available for sale primarily comprise treasury bills not listed on a recognised exchange but for
which there is a liquid market.
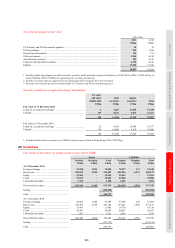
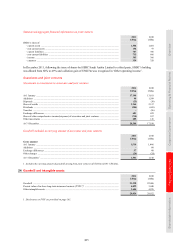
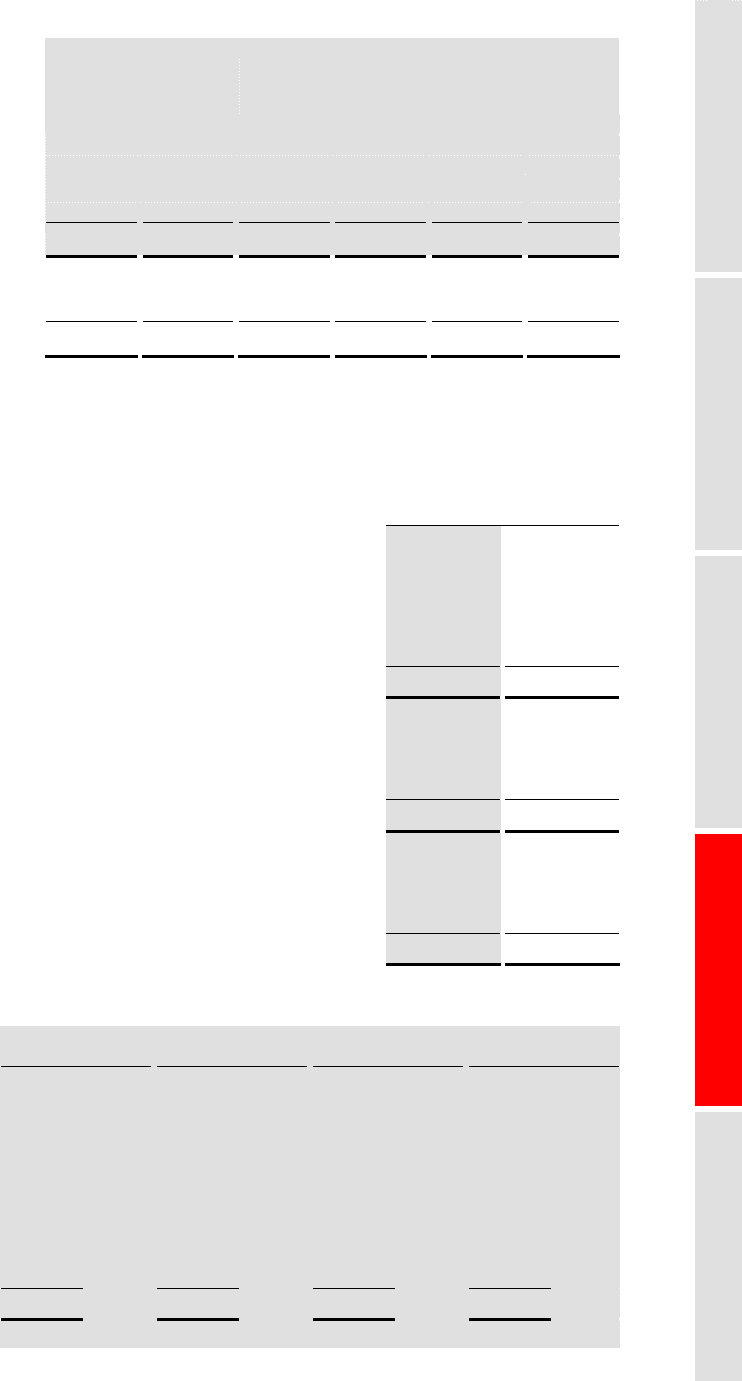
Maturities of investments in debt securities at their carrying amount
At 31 December
2011 2010
US$m US$m
Remaining contractual maturity of total debt securities:
1 year or less ......................................................................................................................................... 87,080 92,961
5 years or less but over 1 year .............................................................................................................. 128,192 124,596
10 years or less but over 5 years .......................................................................................................... 52,251 56,926
Over 10 years ........................................................................................................................................ 60,088 61,160
327,611 335,643
Remaining contractual maturity of debt securities available for sale:
1 year or less ......................................................................................................................................... 85,821 91,939
5 years or less but over 1 year .............................................................................................................. 120,763 117,931
10 years or less but over 5 years .......................................................................................................... 44,946 50,113
Over 10 years ........................................................................................................................................ 55,063 56,274
306,593 316,257
Remaining contractual maturity of debt securities held to maturity:
1 year or less ......................................................................................................................................... 1,259 1,022
5 years or less but over 1 year .............................................................................................................. 7,429 6,665
10 years or less but over 5 years .......................................................................................................... 7,305 6,813
Over 10 years ........................................................................................................................................ 5,025 4,886
21,018 19,386
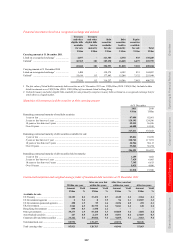
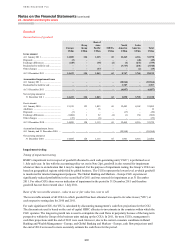
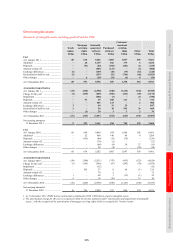
Contractual maturities and weighted average yields of investment debt securities at 31 December 2011
Within one year
After one year but
within five years
After five years but
within ten years After ten years
Amount Yield Amount Yield Amount Yield Amount Yield
US$m % US$m % US$m % US$m %
Available-for-sale
US Treasury ............................................. 12,153 0.4 17,474 0.7 4,340 2.2 2,964 4.1
US Government agencies ........................ 2 5.4 8 3.9 96 2.1 24,587 3.3
US Government-sponsored agencies ....... 458 1.5 55 1.6 2,036 4.0 451 4.1
UK Government ....................................... 3,542 4.5 15,775 1.4 9,041 2.4 618 2.2
Hong Kong Government ......................... 895 0.3 1,558 1.2 – – – –
Other governments .................................. 35,273 1.9 53,418 3.3 10,805 3.6 1,884 4.4
Asset-backed securities ........................... 427 0.5 2,133 0.5 8,501 0.4 23,869 0.3
Corporate debt and other securities ......... 33,242 2.6 29,016 3.4 9,055 3.2 3,963 5.4
Total amortised cost ................................. 85,992 119,437 43,874 58,336
Total carrying value ................................. 85,821 120,763 44,946 55,063