HSBC 2011 Annual Report Download - page 17
Download and view the complete annual report
Please find page 17 of the 2011 HSBC annual report below. You can navigate through the pages in the report by either clicking on the pages listed below, or by using the keyword search tool below to find specific information within the annual report.-
 1
1 -
2
-
3
-
4
-
5
-
6
-
 7
7 -
 8
8 -
 9
9 -
 10
10 -
 11
11 -
 12
12 -
 13
13 -
 14
14 -
 15
15 -
 16
16 -
 17
17 -
 18
18 -
 19
19 -
 20
20 -
 21
21 -
 22
22 -
 23
23 -
 24
24 -
 25
25 -
 26
26 -
 27
27 -
28
-
29
-
30
-
31
-
32
-
33
-
34
-
35
-
36
-
37
-
38
-
39
-
40
-
41
-
42
-
43
-
44
-
45
-
46
-
47
-
48
-
49
-
50
-
51
-
52
-
53
-
54
-
55
-
56
-
57
-
58
-
59
-
60
-
61
-
62
-
63
-
64
-
65
-
66
-
67
-
68
-
69
-
70
-
71
-
72
-
73
-
74
-
75
-
76
-
77
-
78
-
79
-
80
-
81
-
82
-
83
-
84
-
85
-
86
-
87
-
88
-
89
-
90
-
91
-
92
-
93
-
94
-
95
-
96
-
97
-
98
-
99
-
100
-
101
-
102
-
103
-
104
-
105
-
106
-
107
-
108
-
109
-
110
-
111
-
112
-
113
-
114
-
115
-
116
-
117
-
118
-
119
-
120
-
121
-
122
-
123
-
124
-
125
-
126
-
127
-
128
-
129
-
130
-
131
-
132
-
133
-
134
-
135
-
136
-
137
-
138
-
139
-
140
-
141
-
142
-
143
-
144
-
145
-
146
-
147
-
148
-
149
-
150
-
151
-
152
-
153
-
154
-
155
-
156
-
157
-
158
-
159
-
160
-
161
-
162
-
163
-
164
-
165
-
166
-
167
-
168
-
169
-
170
-
171
-
172
-
173
-
174
-
175
-
176
-
177
-
178
-
179
-
180
-
181
-
182
-
183
-
184
-
185
-
186
-
187
-
188
-
189
-
190
-
191
-
192
-
193
-
194
-
195
-
196
-
197
-
198
-
199
-
200
-
201
-
202
-
203
-
204
-
205
-
206
-
207
-
208
-
209
-
210
-
211
-
212
-
213
-
214
-
215
-
216
-
217
-
218
-
219
-
220
-
221
-
222
-
223
-
224
-
225
-
226
-
227
-
228
-
229
-
230
-
231
-
232
-
233
-
234
-
235
-
236
-
237
-
238
-
239
-
240
-
241
-
242
-
243
-
244
-
245
-
246
-
247
-
248
-
249
-
250
-
251
-
252
-
253
-
254
-
255
-
256
-
257
-
258
-
259
-
260
-
261
-
262
-
263
-
264
-
265
-
266
-
267
-
268
-
269
-
270
-
271
-
272
-
273
-
274
-
275
-
276
-
277
-
278
-
279
-
280
-
281
-
282
-
283
-
284
-
285
-
286
-
287
-
288
-
289
-
290
-
291
-
292
-
293
-
294
-
295
-
296
-
297
-
298
-
299
-
300
-
301
-
302
-
303
-
304
-
305
-
306
-
307
-
308
-
309
-
310
-
311
-
312
-
313
-
314
-
315
-
316
-
317
-
318
-
319
-
320
-
321
-
322
-
323
-
324
-
325
-
326
-
327
-
328
-
329
-
330
-
331
-
332
-
333
-
334
-
335
-
336
-
337
-
338
-
339
-
340
-
341
-
342
-
343
-
344
-
345
-
346
-
347
-
348
-
349
-
350
-
351
-
352
-
353
-
354
-
355
-
356
-
357
-
358
-
359
-
360
-
361
-
362
-
363
-
364
-
365
-
366
-
367
-
368
-
369
-
370
-
371
-
372
-
373
-
374
-
375
-
376
-
377
-
378
-
379
-
380
-
381
-
382
-
383
-
384
-
385
-
386
-
387
-
388
-
389
-
390
-
391
-
392
-
393
-
394
-
395
-
396
-
397
-
398
-
399
-
400
-
401
-
402
-
403
-
404
-
405
-
406
-
407
-
408
-
409
-
410
-
411
-
412
-
413
-
414
-
415
-
416
-
417
-
418
-
419
-
420
-
421
-
422
-
423
-
424
-
425
-
426
-
427
-
428
-
429
-
430
-
431
-
432
-
433
-
434
-
435
-
436
-
437
-
438
-
439
-
440
 |
 |

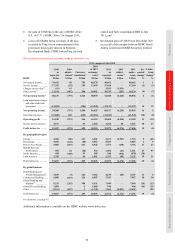
15
Overview Operating & Financial Review Corporate Governance Financial Statements Shareholder Information
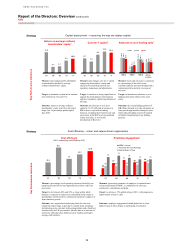
Growth – continue to position ourselves for growth Strategy
Risk-adjusted revenue growth
(2011: underlying growth 2%)
Basic earnings
per ordinary share
Dividends per ordinary
share growth
13
(8)
(30)
11
37
'07 '08 '09 '10 '11
1.4
0.4 0.3
0.7
0.9
'07 '08 '09 '10 '11
11
(47)
(29)
14
6
'07 '08 '09 '10 '11
Measure: (percentage) increase in reporte
d
net operating income after loan impairment
and other credit risk charges since last
year.
Measure: (US$) level of basic earnings
generated per ordinary share.
Measure: (percentage) increase in
dividends per share since last year, based
on dividends paid in respect of the year to
which the dividend relates.
Target: to deliver consistent growth in ris
k
adjusted revenues.
Target: to deliver consistent growth in
basic earnings per share.
Target: to deliver sustained dividend per
share growth.
Outcome: reported risk-adjusted revenue
increased primarily due to favourable
movements on the fair value of own debt
due to credit spreads and on an underlying
basis due to lower loan impairment
charges.
Outcome: Earnings per share (‘EPS’)
increased in 2011 reflecting significant
favourable movements on the fair value of
own debt due to credit spreads which
resulted in an increase in reported profits.
Outcome: dividends per share increased
by 14%.
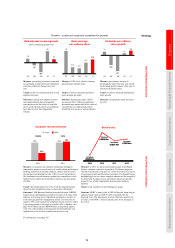
Key Performance Indicators
Customer recommendation Brand value
2011 2011
Target HSBC
75% 75%
35%
79%
RBWM CMB
1st place
US$25.4bn
2009 2010 2011 2012
1st place
US$28.5bn
3rd place
US$27.4bn
1st place
US$27.6bn
1st place
US$25.4bn
2009 2010 2011 2012
1st place
US$28.5bn
3rd place
US$27.4bn
1st place
US$27.6bn
Measure: we measure our customer satisfaction through an
independent market research survey of retail banking and business
banking customers in selected countries, using a specific metric
of customer recommendation (the ‘CRI’) to score performance.
We benchmark our performance against key competitors in each
market and set targets for performance based on our peer group
of banks.
Measure: in 2011, we moved our brand measure to the Brand
Finance valuation method as reported in The Banker magazine.
Our previous measure only gave us a score derived from a survey
of our personal and small business customers. The Brand Finance
methodology gives us a more complete measure of the strength of
the brand and its impact across all business lines and customer
groups. It is a wholly independent measure and is publicly
reported.
Target: the Group target is for 75% of all the selected markets
(based on their weighted revenue) to meet their CRI targets.
Target: a top 3 position in the banking peer group.
Outcome: CMB Business Banking exceeded its target. RBWM
experienced a challenging environment in many of its large retail
markets, with strong local competition and negative reaction to
some strategic portfolio management activity, and only met its
target in 35% of the markets by weighted revenue. It got to within
2 percentage points of its target in a further 44% of markets. See
page 46 for further details. RBWM had a strong fourth quarter,
with 77% of the markets meeting target and it finished the year
ranked first in five of the six markets surveyed in Asia.
Outcome: HSBC’s brand value in 2009 followed a sharp drop in
industry brand values in 2008/9 which coincided with the
financial crisis. The subsequent increase reflected a general rise
in values, with HSBC’s brand remaining one of the strongest in
the sector.
Key Performance Indicators
For footnotes, see page 95.