HSBC 2011 Annual Report Download - page 351
Download and view the complete annual report
Please find page 351 of the 2011 HSBC annual report below. You can navigate through the pages in the report by either clicking on the pages listed below, or by using the keyword search tool below to find specific information within the annual report.-
 1
1 -
2
-
3
-
4
-
5
-
6
-
7
-
8
-
9
-
10
-
11
-
12
-
13
-
14
-
15
-
16
-
17
-
18
-
19
-
20
-
21
-
22
-
23
-
24
-
25
-
26
-
27
-
28
-
29
-
30
-
31
-
32
-
33
-
34
-
35
-
36
-
37
-
38
-
39
-
40
-
41
-
42
-
43
-
44
-
45
-
46
-
47
-
48
-
49
-
50
-
51
-
52
-
53
-
54
-
55
-
56
-
57
-
58
-
59
-
60
-
61
-
62
-
63
-
64
-
65
-
66
-
67
-
68
-
69
-
70
-
71
-
72
-
73
-
74
-
75
-
76
-
77
-
78
-
79
-
80
-
81
-
82
-
83
-
84
-
85
-
86
-
87
-
88
-
89
-
90
-
91
-
92
-
93
-
94
-
95
-
96
-
97
-
98
-
99
-
100
-
101
-
102
-
103
-
104
-
105
-
106
-
107
-
108
-
109
-
110
-
111
-
112
-
113
-
114
-
115
-
116
-
117
-
118
-
119
-
120
-
121
-
122
-
123
-
124
-
125
-
126
-
127
-
128
-
129
-
130
-
131
-
132
-
133
-
134
-
135
-
136
-
137
-
138
-
139
-
140
-
141
-
142
-
143
-
144
-
145
-
146
-
147
-
148
-
149
-
150
-
151
-
152
-
153
-
154
-
155
-
156
-
157
-
158
-
159
-
160
-
161
-
162
-
163
-
164
-
165
-
166
-
167
-
168
-
169
-
170
-
171
-
172
-
173
-
174
-
175
-
176
-
177
-
178
-
179
-
180
-
181
-
182
-
183
-
184
-
185
-
186
-
187
-
188
-
189
-
190
-
191
-
192
-
193
-
194
-
195
-
196
-
197
-
198
-
199
-
200
-
201
-
202
-
203
-
204
-
205
-
206
-
207
-
208
-
209
-
210
-
211
-
212
-
213
-
214
-
215
-
216
-
217
-
218
-
219
-
220
-
221
-
222
-
223
-
224
-
225
-
226
-
227
-
228
-
229
-
230
-
231
-
232
-
233
-
234
-
235
-
236
-
237
-
238
-
239
-
240
-
241
-
242
-
243
-
244
-
245
-
246
-
247
-
248
-
249
-
250
-
251
-
252
-
253
-
254
-
255
-
256
-
257
-
258
-
259
-
260
-
261
-
262
-
263
-
264
-
265
-
266
-
267
-
268
-
269
-
270
-
271
-
272
-
273
-
274
-
275
-
276
-
277
-
278
-
279
-
280
-
281
-
282
-
283
-
284
-
285
-
286
-
287
-
288
-
289
-
290
-
291
-
292
-
293
-
294
-
295
-
296
-
297
-
298
-
299
-
300
-
301
-
302
-
303
-
304
-
305
-
306
-
307
-
308
-
309
-
310
-
311
-
312
-
313
-
314
-
315
-
316
-
317
-
318
-
319
-
320
-
321
-
322
-
323
-
324
-
325
-
326
-
327
-
328
-
329
-
330
-
331
-
332
-
333
-
334
-
335
-
336
-
337
-
338
-
339
-
340
-
 341
341 -
 342
342 -
 343
343 -
 344
344 -
 345
345 -
 346
346 -
 347
347 -
 348
348 -
 349
349 -
 350
350 -
 351
351 -
 352
352 -
 353
353 -
 354
354 -
 355
355 -
 356
356 -
 357
357 -
 358
358 -
 359
359 -
 360
360 -
 361
361 -
362
-
363
-
364
-
365
-
366
-
367
-
368
-
369
-
370
-
371
-
372
-
373
-
374
-
375
-
376
-
377
-
378
-
379
-
380
-
381
-
382
-
383
-
384
-
385
-
386
-
387
-
388
-
389
-
390
-
391
-
392
-
393
-
394
-
395
-
396
-
397
-
398
-
399
-
400
-
401
-
402
-
403
-
404
-
405
-
406
-
407
-
408
-
409
-
410
-
411
-
412
-
413
-
414
-
415
-
416
-
417
-
418
-
419
-
420
-
421
-
422
-
423
-
424
-
425
-
426
-
427
-
428
-
429
-
430
-
431
-
432
-
433
-
434
-
435
-
436
-
437
-
438
-
439
-
440
 |
 |

349
Overview Operating & Financial Review Corporate Governance Financial Statements Shareholder Information
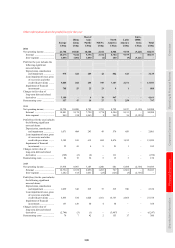
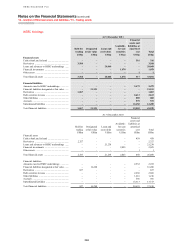
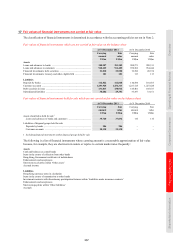
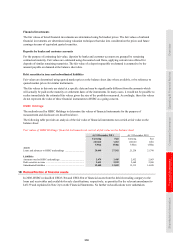
Global Banking and Markets fair value adjustments
At 31 December
2011 2010
US$m US$m
Type of adjustment
Risk-related ............................................................................................................................................... 1,899 2,171
Bid-offer ............................................................................................................................................... 695 620
Uncertainty ........................................................................................................................................... 154 136
Credit valuation adjustment ................................................................................................................. 1,050 1,355
Other ..................................................................................................................................................... – 60
Model-related ............................................................................................................................................ 567 389
Model limitation ................................................................................................................................... 567 383
Other ..................................................................................................................................................... – 6
Inception profit (Day 1 P&L reserves) (Note 20) .................................................................................... 200 250
2,666 2,810
The most significant fair value adjustment change during 2011 related to the release of US$215m of credit valuation
adjustments held for monoline insurers of which US$183m resulted from commutations. The commutations did not
result in a material gain or loss. The remainder of the decrease in the credit valuation adjustment resulted from a
variety of factors, including changes in exposure profiles and internal credit rating upgrades or downgrades across a
wide range of counterparties.
The increase in model limitation adjustments primarily reflects an increase in the adjustment for OIS discounting
following the widening of OIS-Libor spreads during the second half of 2011.
Risk-related adjustments
Bid-offer
IAS 39 requires that portfolios are marked at bid or offer, as appropriate. Valuation models will typically generate
mid market values. The bid-offer adjustment reflects the cost that would be incurred if substantially all residual net
portfolio market risks were closed using available hedging instruments or by disposing of or unwinding the actual
position.
Uncertainty
Certain model inputs may be less readily determinable from market data, and/or the choice of model itself may be
more subjective. In these circumstances, there exists a range of possible values that the financial instrument or market
parameter may assume and an adjustment may be necessary to reflect the likelihood that in estimating the fair value
of the financial instrument, market participants would adopt rather more conservative values for uncertain parameters
and/or model assumptions than those used in the valuation model.
Credit valuation adjustment
The credit valuation adjustment is an adjustment to the valuation of OTC derivative contracts to reflect within fair
value the possibility that the counterparty may default and HSBC may not receive the full market value of the
transactions.
Model-related adjustments
Model limitation
Models used for portfolio valuation purposes may be based upon a simplifying set of assumptions that do not
capture all material market characteristics. Additionally, markets evolve, and models that were adequate in the
past may require development to capture all material market characteristics in current market conditions. In these
circumstances, model limitation adjustments are adopted. As model development progresses, model limitations are
addressed within the valuation models and a model limitation adjustment is no longer needed.