HSBC 2011 Annual Report Download - page 267
Download and view the complete annual report
Please find page 267 of the 2011 HSBC annual report below. You can navigate through the pages in the report by either clicking on the pages listed below, or by using the keyword search tool below to find specific information within the annual report.-
 1
1 -
2
-
3
-
4
-
5
-
6
-
7
-
8
-
9
-
10
-
11
-
12
-
13
-
14
-
15
-
16
-
17
-
18
-
19
-
20
-
21
-
22
-
23
-
24
-
25
-
26
-
27
-
28
-
29
-
30
-
31
-
32
-
33
-
34
-
35
-
36
-
37
-
38
-
39
-
40
-
41
-
42
-
43
-
44
-
45
-
46
-
47
-
48
-
49
-
50
-
51
-
52
-
53
-
54
-
55
-
56
-
57
-
58
-
59
-
60
-
61
-
62
-
63
-
64
-
65
-
66
-
67
-
68
-
69
-
70
-
71
-
72
-
73
-
74
-
75
-
76
-
77
-
78
-
79
-
80
-
81
-
82
-
83
-
84
-
85
-
86
-
87
-
88
-
89
-
90
-
91
-
92
-
93
-
94
-
95
-
96
-
97
-
98
-
99
-
100
-
101
-
102
-
103
-
104
-
105
-
106
-
107
-
108
-
109
-
110
-
111
-
112
-
113
-
114
-
115
-
116
-
117
-
118
-
119
-
120
-
121
-
122
-
123
-
124
-
125
-
126
-
127
-
128
-
129
-
130
-
131
-
132
-
133
-
134
-
135
-
136
-
137
-
138
-
139
-
140
-
141
-
142
-
143
-
144
-
145
-
146
-
147
-
148
-
149
-
150
-
151
-
152
-
153
-
154
-
155
-
156
-
157
-
158
-
159
-
160
-
161
-
162
-
163
-
164
-
165
-
166
-
167
-
168
-
169
-
170
-
171
-
172
-
173
-
174
-
175
-
176
-
177
-
178
-
179
-
180
-
181
-
182
-
183
-
184
-
185
-
186
-
187
-
188
-
189
-
190
-
191
-
192
-
193
-
194
-
195
-
196
-
197
-
198
-
199
-
200
-
201
-
202
-
203
-
204
-
205
-
206
-
207
-
208
-
209
-
210
-
211
-
212
-
213
-
214
-
215
-
216
-
217
-
218
-
219
-
220
-
221
-
222
-
223
-
224
-
225
-
226
-
227
-
228
-
229
-
230
-
231
-
232
-
233
-
234
-
235
-
236
-
237
-
238
-
239
-
240
-
241
-
242
-
243
-
244
-
245
-
246
-
247
-
248
-
249
-
250
-
251
-
252
-
253
-
254
-
255
-
256
-
 257
257 -
 258
258 -
 259
259 -
 260
260 -
 261
261 -
 262
262 -
 263
263 -
 264
264 -
 265
265 -
 266
266 -
 267
267 -
 268
268 -
 269
269 -
 270
270 -
 271
271 -
 272
272 -
 273
273 -
 274
274 -
 275
275 -
 276
276 -
 277
277 -
278
-
279
-
280
-
281
-
282
-
283
-
284
-
285
-
286
-
287
-
288
-
289
-
290
-
291
-
292
-
293
-
294
-
295
-
296
-
297
-
298
-
299
-
300
-
301
-
302
-
303
-
304
-
305
-
306
-
307
-
308
-
309
-
310
-
311
-
312
-
313
-
314
-
315
-
316
-
317
-
318
-
319
-
320
-
321
-
322
-
323
-
324
-
325
-
326
-
327
-
328
-
329
-
330
-
331
-
332
-
333
-
334
-
335
-
336
-
337
-
338
-
339
-
340
-
341
-
342
-
343
-
344
-
345
-
346
-
347
-
348
-
349
-
350
-
351
-
352
-
353
-
354
-
355
-
356
-
357
-
358
-
359
-
360
-
361
-
362
-
363
-
364
-
365
-
366
-
367
-
368
-
369
-
370
-
371
-
372
-
373
-
374
-
375
-
376
-
377
-
378
-
379
-
380
-
381
-
382
-
383
-
384
-
385
-
386
-
387
-
388
-
389
-
390
-
391
-
392
-
393
-
394
-
395
-
396
-
397
-
398
-
399
-
400
-
401
-
402
-
403
-
404
-
405
-
406
-
407
-
408
-
409
-
410
-
411
-
412
-
413
-
414
-
415
-
416
-
417
-
418
-
419
-
420
-
421
-
422
-
423
-
424
-
425
-
426
-
427
-
428
-
429
-
430
-
431
-
432
-
433
-
434
-
435
-
436
-
437
-
438
-
439
-
440
 |
 |

265
Overview Operating & Financial Review Corporate Governance Financial Statements Shareholder Information
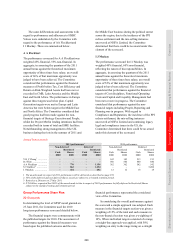
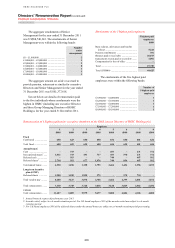
2011 executive Directors’ emoluments and
remuneration
The following table shows the 2011 emoluments
of the Group Chairman and executive Directors of
HSBC Holdings, with annual bonus disclosed on an
actual paid basis, pursuant to section 421 of the UK
Companies Act 2006 and the Large and Medium-
sized Companies and Groups (Accounts and
Reports) Regulations 2008:
Directors’ emoluments
V H C Cheng1 D J Flint A A Flockhart S T Gulliver I J Mackay1
(Audited) 2011 2010 2011 2010 2011 2010 2011 2010 2011 2010
£000
Salary .......................... 382 775 1,500 845 975 820 1,250 800 700 57
Allowances2 ................ 142 193 750 434 366 – 527 154 364 36
Benefits in kind3 .......... 133 311 98 8 237 629 266 17 363 27
Bonus4 ......................... 124 284 1,054 1,805 1,627 1,385 4,559 2,934 446 24
Total emoluments ....... 781 1,563 3,402 3,092 3,205 2,834 6,602 3,905 1,873 144
US$000
Total emoluments ....... 1,252 2,414 5,452 4,775 5,136 4,377 10,581 6,031 3,002 222
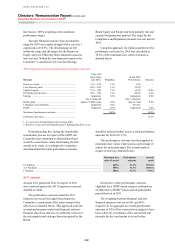
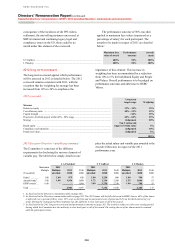
The following table shows the 2011 total
remuneration of the Group Chairman and executive
Directors of HSBC Holdings with annual bonus
disclosed on a 2011 performance year basis,
pursuant to the UK Listing Rules. Explanations of
the constituent parts of the bonus calculated pursuant
to the UK Companies Act 2006 and the UK Listing
Rules are given in footnotes 4 and 5, respectively.
Directors’ remuneration
V H C Cheng1 D J Flint A A Flockhart S T Gulliver I J Mackay1
(Unaudited) 2011 2010 2011 2010 2011 2010 2011 2010 2011 2010
£000
Salary, allowances and
benefits in kind ........ 657 1,279 2,348 1,287 1,578 1,449 2,043 971 1,427 120
Bonus5 ......................... – 711 – 2,800 1,926 1,808 2,156 5,200 1,086 61
Total remuneration ..... 657 1,990 2,348 4,087 3,504 3,257 4,199 6,171 2,513 181
US$000
Total remuneration ..... 1,053 3,073 3,763 6,312 5,616 5,030 6,729 9,530 4,027 280
1 V H C Cheng retired as a Director on 27 May 2011 and I J Mackay was appointed as a Director on 3 December 2010.
2 Allowances include an executive allowance paid to fund personal pension arrangements.
3 Benefits in kind include provision of medical insurance, other insurance cover, accountancy advice and travel assistance. S T Gulliver is
also provided with HSBC owned accommodation whilst in Hong Kong. In accordance with the Large and Medium-sized Companies and
Groups (Accounts and Reports) Regulations 2008, the taxable rental value of the property is shown for the whole period from 4 August
2011 to 31 December 2011 notwithstanding that it is only occupied when S T Gulliver is in Hong Kong. I J Mackay relocated to London
and he received temporary accommodation for him and his family together with other normal relocation benefits. Prior to relocating to
the UK from Hong Kong, and whilst being subject to tax in Hong Kong, A A Flockhart also incurred a tax liability in the UK as a result
of a number of business trips to the UK at the request of the Group. This liability was covered by HSBC.
4 Where applicable, bonus comprises: (i) the estimated monetary value of 33% of the award of HSBC Holdings Restricted Shares that will
vest on 15 March 2012 arising from the 2010 bonus awarded in March 2011 that was partly deferred into awards of HSBC Holdings
Restricted Shares, as follows: V H C Cheng, £53,000, D J Flint, £219,000, A A Flockhart, £141,000, S T Gulliver, £1,353,000 and
I J Mackay, £5,000; (ii) the estimated monetary value of 33% of the award of HSBC Holdings Restricted Shares that will vest on
5 March 2012 arising from the 2009 bonus awarded in March 2010 that was fully deferred into awards of HSBC Restricted Shares as
follows: D J Flint, £547,000, A A Flockhart, £529,000 and S T Gulliver, £2,343,000 and (iii) 40% of the annual bonus in respect of the
2011 performance year that is non-deferred. The non-deferred bonus is payable in HSBC Holdings Restricted Shares, 50% of which are
subject to a six month retention period. Full details are set out above and on page 259.
5 The bonus for 2011 comprises the deferred and non-deferred bonus, details of which are set out above and on pages 259.
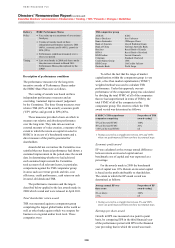
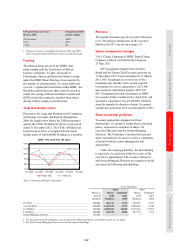
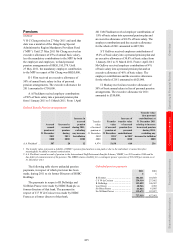
Performance Shares under the HSBC Share
Plan (This plan is no longer in use)
As previously noted this plan has been replaced by
the HSBC Share Plan 2011 which includes the
GPSP. The last award made under this plan was in
2008 and vested in 2011. Accordingly the plan is
detailed below. No further awards will be made
under this plan.
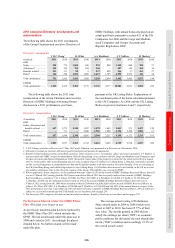
The average actual vesting of Performance
Share awards made in 2004 to 2008 (which were
tested in 2007 to 2011) has been 25.77% of their
face value. The awards granted in 2008 did not
satisfy the earnings per share (‘EPS’) or economic
profit conditions but did satisfy the total shareholder
return (‘TSR’) condition and accordingly 21.3% of
the overall award vested.