HSBC 2011 Annual Report Download - page 331
Download and view the complete annual report
Please find page 331 of the 2011 HSBC annual report below. You can navigate through the pages in the report by either clicking on the pages listed below, or by using the keyword search tool below to find specific information within the annual report.-
 1
1 -
2
-
3
-
4
-
5
-
6
-
7
-
8
-
9
-
10
-
11
-
12
-
13
-
14
-
15
-
16
-
17
-
18
-
19
-
20
-
21
-
22
-
23
-
24
-
25
-
26
-
27
-
28
-
29
-
30
-
31
-
32
-
33
-
34
-
35
-
36
-
37
-
38
-
39
-
40
-
41
-
42
-
43
-
44
-
45
-
46
-
47
-
48
-
49
-
50
-
51
-
52
-
53
-
54
-
55
-
56
-
57
-
58
-
59
-
60
-
61
-
62
-
63
-
64
-
65
-
66
-
67
-
68
-
69
-
70
-
71
-
72
-
73
-
74
-
75
-
76
-
77
-
78
-
79
-
80
-
81
-
82
-
83
-
84
-
85
-
86
-
87
-
88
-
89
-
90
-
91
-
92
-
93
-
94
-
95
-
96
-
97
-
98
-
99
-
100
-
101
-
102
-
103
-
104
-
105
-
106
-
107
-
108
-
109
-
110
-
111
-
112
-
113
-
114
-
115
-
116
-
117
-
118
-
119
-
120
-
121
-
122
-
123
-
124
-
125
-
126
-
127
-
128
-
129
-
130
-
131
-
132
-
133
-
134
-
135
-
136
-
137
-
138
-
139
-
140
-
141
-
142
-
143
-
144
-
145
-
146
-
147
-
148
-
149
-
150
-
151
-
152
-
153
-
154
-
155
-
156
-
157
-
158
-
159
-
160
-
161
-
162
-
163
-
164
-
165
-
166
-
167
-
168
-
169
-
170
-
171
-
172
-
173
-
174
-
175
-
176
-
177
-
178
-
179
-
180
-
181
-
182
-
183
-
184
-
185
-
186
-
187
-
188
-
189
-
190
-
191
-
192
-
193
-
194
-
195
-
196
-
197
-
198
-
199
-
200
-
201
-
202
-
203
-
204
-
205
-
206
-
207
-
208
-
209
-
210
-
211
-
212
-
213
-
214
-
215
-
216
-
217
-
218
-
219
-
220
-
221
-
222
-
223
-
224
-
225
-
226
-
227
-
228
-
229
-
230
-
231
-
232
-
233
-
234
-
235
-
236
-
237
-
238
-
239
-
240
-
241
-
242
-
243
-
244
-
245
-
246
-
247
-
248
-
249
-
250
-
251
-
252
-
253
-
254
-
255
-
256
-
257
-
258
-
259
-
260
-
261
-
262
-
263
-
264
-
265
-
266
-
267
-
268
-
269
-
270
-
271
-
272
-
273
-
274
-
275
-
276
-
277
-
278
-
279
-
280
-
281
-
282
-
283
-
284
-
285
-
286
-
287
-
288
-
289
-
290
-
291
-
292
-
293
-
294
-
295
-
296
-
297
-
298
-
299
-
300
-
301
-
302
-
303
-
304
-
305
-
306
-
307
-
308
-
309
-
310
-
311
-
312
-
313
-
314
-
315
-
316
-
317
-
318
-
319
-
320
-
 321
321 -
 322
322 -
 323
323 -
 324
324 -
 325
325 -
 326
326 -
 327
327 -
 328
328 -
 329
329 -
 330
330 -
 331
331 -
 332
332 -
 333
333 -
 334
334 -
 335
335 -
 336
336 -
 337
337 -
 338
338 -
 339
339 -
 340
340 -
 341
341 -
342
-
343
-
344
-
345
-
346
-
347
-
348
-
349
-
350
-
351
-
352
-
353
-
354
-
355
-
356
-
357
-
358
-
359
-
360
-
361
-
362
-
363
-
364
-
365
-
366
-
367
-
368
-
369
-
370
-
371
-
372
-
373
-
374
-
375
-
376
-
377
-
378
-
379
-
380
-
381
-
382
-
383
-
384
-
385
-
386
-
387
-
388
-
389
-
390
-
391
-
392
-
393
-
394
-
395
-
396
-
397
-
398
-
399
-
400
-
401
-
402
-
403
-
404
-
405
-
406
-
407
-
408
-
409
-
410
-
411
-
412
-
413
-
414
-
415
-
416
-
417
-
418
-
419
-
420
-
421
-
422
-
423
-
424
-
425
-
426
-
427
-
428
-
429
-
430
-
431
-
432
-
433
-
434
-
435
-
436
-
437
-
438
-
439
-
440
 |
 |

329
Overview Operating & Financial Review Corporate Governance Financial Statements Shareholder Information
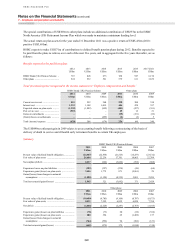
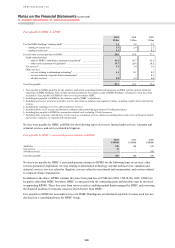
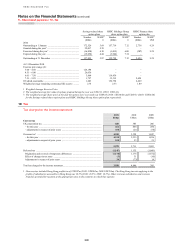
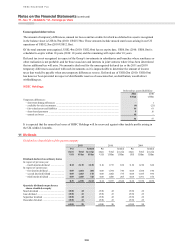
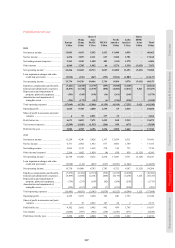
Significant weighted average assumptions used to estimate the fair value of options granted
Savings-related share option plans
1-year plan 3-year plans 5-year plans
2011
Risk-free interest rate1 (%) ......................................................................................... 0.8 1.7 2.5
Expected life (years) ................................................................................................... 1 3 5
Expected volatility2 (%) .............................................................................................. 25 25 25
Share price at grant date (£) ........................................................................................ 6.37 6.37 6.37
2010
Risk-free interest rate1 (%) ......................................................................................... 0.7 1.9 2.9
Expected life (years) ................................................................................................... 1 3 5
Expected volatility2 (%) .............................................................................................. 30 30 30
Share price at grant date (£) ........................................................................................ 6.82 6.82 6.82
2009
Risk-free interest rate1 (%) ......................................................................................... 0.7 2.1 2.4
Expected life (years) ................................................................................................... 1 3 5
Expected volatility2 (%) .............................................................................................. 50 35 30
Share price at grant date (£) ........................................................................................ 4.65 4.65 4.65
1 The risk-free rate was determined from the UK gilts yield curve. A similar yield curve was used for the International Savings-Related
Share Option Plans.
2 Expected volatility is estimated by considering both historic average share price volatility and implied volatility derived from traded
options over HSBC shares of similar maturity to those of the employee options.
The expected US dollar denominated dividend yield was determined to be 4.5% per annum in line with consensus
analyst forecasts (2010: 4.5%; 2009: 4.5%).
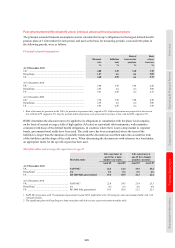
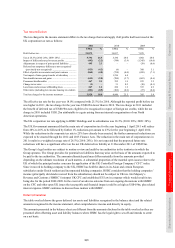
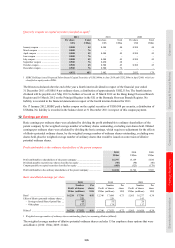
HSBC subsidiary company share option plans
There are a number of employee share option plans relating to HSBC France, HSBC Finance and HSBC Bank
Bermuda as a result of the acquisition of these entities.
Options granted prior to public announcement of the acquisitions, vested on acquisition and are not included in the
table below. HSBC France and HSBC Finance granted share options after announcement of the acquisition which
vested in subsequent years. Of these, as at 31 December 2011, only 2.4m HSBC Finance options (2010: 2.4m)
remained outstanding and are included in the table below. Full details of all options outstanding under these plans can
be found in Note 39.
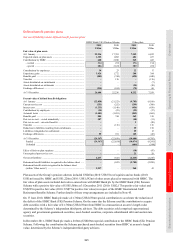
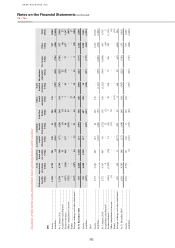
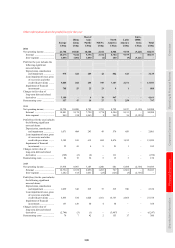
Movement on HSBC share option plans
Savings-related share
option plans
HSBC Holdings Group
share option plan
HSBC Finance share
option plan
Number
(000s)
WAEP1
£
Number
(000s)
WAEP1
£
Number
(000s)
WAEP1
US$
2011
Outstanding at 1 January ...................................................... 157,855 3.87 152,758 7.12 2,429 9.29
Granted during the year2 ....................................................... 23,199 5.11 – – – –
Exercised during the year3 .................................................... (7,439) 5.27 (646) 6.06 – –
Expired during the year ........................................................ (20,150) 4.71 (31,320) 7.56 – –
Outstanding at 31 December ................................................ 153,465 3.80 120,792 7.02 2,429 9.29
At 31 December 2011
Exercise price range (£):
3.00 – 4.50 ........................................................................ 117,387 – –
4.51 – 6.00 ........................................................................ 32,778 – –
6.01 – 7.50 ........................................................................ 2,341 115,901 –
7.51 – 9.29 ........................................................................ 959 4,891 2,429
Of which exercisable ............................................................ 3,209 120,792 2,429
Weighted average remaining contractual life (years) .......... 2.04 1.66 0.89