HSBC 2011 Annual Report Download - page 108
Download and view the complete annual report
Please find page 108 of the 2011 HSBC annual report below. You can navigate through the pages in the report by either clicking on the pages listed below, or by using the keyword search tool below to find specific information within the annual report.-
 1
1 -
2
-
3
-
4
-
5
-
6
-
7
-
8
-
9
-
10
-
11
-
12
-
13
-
14
-
15
-
16
-
17
-
18
-
19
-
20
-
21
-
22
-
23
-
24
-
25
-
26
-
27
-
28
-
29
-
30
-
31
-
32
-
33
-
34
-
35
-
36
-
37
-
38
-
39
-
40
-
41
-
42
-
43
-
44
-
45
-
46
-
47
-
48
-
49
-
50
-
51
-
52
-
53
-
54
-
55
-
56
-
57
-
58
-
59
-
60
-
61
-
62
-
63
-
64
-
65
-
66
-
67
-
68
-
69
-
70
-
71
-
72
-
73
-
74
-
75
-
76
-
77
-
78
-
79
-
80
-
81
-
82
-
83
-
84
-
85
-
86
-
87
-
88
-
89
-
90
-
91
-
92
-
93
-
94
-
95
-
96
-
97
-
 98
98 -
 99
99 -
 100
100 -
 101
101 -
 102
102 -
 103
103 -
 104
104 -
 105
105 -
 106
106 -
 107
107 -
 108
108 -
 109
109 -
 110
110 -
 111
111 -
 112
112 -
 113
113 -
 114
114 -
 115
115 -
 116
116 -
 117
117 -
 118
118 -
119
-
120
-
121
-
122
-
123
-
124
-
125
-
126
-
127
-
128
-
129
-
130
-
131
-
132
-
133
-
134
-
135
-
136
-
137
-
138
-
139
-
140
-
141
-
142
-
143
-
144
-
145
-
146
-
147
-
148
-
149
-
150
-
151
-
152
-
153
-
154
-
155
-
156
-
157
-
158
-
159
-
160
-
161
-
162
-
163
-
164
-
165
-
166
-
167
-
168
-
169
-
170
-
171
-
172
-
173
-
174
-
175
-
176
-
177
-
178
-
179
-
180
-
181
-
182
-
183
-
184
-
185
-
186
-
187
-
188
-
189
-
190
-
191
-
192
-
193
-
194
-
195
-
196
-
197
-
198
-
199
-
200
-
201
-
202
-
203
-
204
-
205
-
206
-
207
-
208
-
209
-
210
-
211
-
212
-
213
-
214
-
215
-
216
-
217
-
218
-
219
-
220
-
221
-
222
-
223
-
224
-
225
-
226
-
227
-
228
-
229
-
230
-
231
-
232
-
233
-
234
-
235
-
236
-
237
-
238
-
239
-
240
-
241
-
242
-
243
-
244
-
245
-
246
-
247
-
248
-
249
-
250
-
251
-
252
-
253
-
254
-
255
-
256
-
257
-
258
-
259
-
260
-
261
-
262
-
263
-
264
-
265
-
266
-
267
-
268
-
269
-
270
-
271
-
272
-
273
-
274
-
275
-
276
-
277
-
278
-
279
-
280
-
281
-
282
-
283
-
284
-
285
-
286
-
287
-
288
-
289
-
290
-
291
-
292
-
293
-
294
-
295
-
296
-
297
-
298
-
299
-
300
-
301
-
302
-
303
-
304
-
305
-
306
-
307
-
308
-
309
-
310
-
311
-
312
-
313
-
314
-
315
-
316
-
317
-
318
-
319
-
320
-
321
-
322
-
323
-
324
-
325
-
326
-
327
-
328
-
329
-
330
-
331
-
332
-
333
-
334
-
335
-
336
-
337
-
338
-
339
-
340
-
341
-
342
-
343
-
344
-
345
-
346
-
347
-
348
-
349
-
350
-
351
-
352
-
353
-
354
-
355
-
356
-
357
-
358
-
359
-
360
-
361
-
362
-
363
-
364
-
365
-
366
-
367
-
368
-
369
-
370
-
371
-
372
-
373
-
374
-
375
-
376
-
377
-
378
-
379
-
380
-
381
-
382
-
383
-
384
-
385
-
386
-
387
-
388
-
389
-
390
-
391
-
392
-
393
-
394
-
395
-
396
-
397
-
398
-
399
-
400
-
401
-
402
-
403
-
404
-
405
-
406
-
407
-
408
-
409
-
410
-
411
-
412
-
413
-
414
-
415
-
416
-
417
-
418
-
419
-
420
-
421
-
422
-
423
-
424
-
425
-
426
-
427
-
428
-
429
-
430
-
431
-
432
-
433
-
434
-
435
-
436
-
437
-
438
-
439
-
440
 |
 |

HSBC HOLDINGS PLC
Report of the Directors: Operating and Financial Review (continued)
Risk > Credit risk > Credit exposure
106
European economic area, in particular by
transferring our excess liquidity away from
sovereign and bank-issued debt securities and from
money market placements with banks to placements
with central banks in the most highly-rated countries.
Despite this, we increased our overall exposure to
credit risk in 2011.
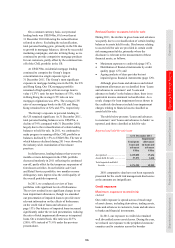
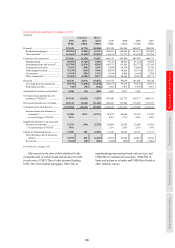
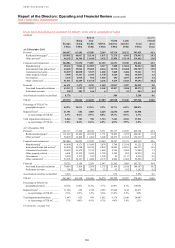
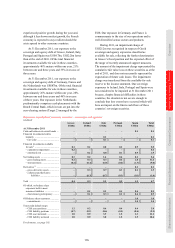
‘Maximum exposure to credit risk’ table (page 107)
The table presents our maximum exposure to credit risk from
balance sheet and off-balance sheet financial instruments
before taking account of any collateral held or other credit
enhancements (unless such enhancements meet accounting
offsetting requirements). For financial assets recognised on
the balance sheet, the maximum exposure to credit risk equals
their carrying amount; for financial guarantees and similar
contracts granted, it is the maximum amount that we would
have to pay if the guarantees were called upon. For loan
commitments and other credit-related commitments that are
irrevocable over the life of the respective facilities, it is
generally the full amount of the committed facilities.
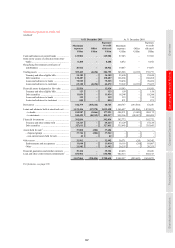
Loans and advances to customers represent our
largest exposure to credit risk; however, this balance
reduced at the end of 2011, compared with the end
of 2010 as certain lending balances were reclassified
as ‘Assets held for sale’. We were able to
successfully grow our residential mortgage
portfolios in many other markets, notably in Hong
Kong and the UK where credit quality remained
high and LTV ratios were low.
Our exposure to loans and advances to banks
decreased in 2011, mainly in Europe as funds from
maturing term loans and reverse repo balances were
redeployed to ‘Cash and balances at central banks’.
This was offset in part by higher central bank
lending in Rest of Asia-Pacific, reflecting strong
deposit growth in the region. Our net exposure to
loans and advances to banks also decreased.
The loans and advances offset adjustment
primarily relates to customer loans and deposits
and balances arising from repo and reverse repo
transactions. The offset relates to balances where
there is a legally enforceable right of offset in the
event of counterparty default and where, as a result,
there is a net exposure for credit risk management
purposes. However, as there is no intention to settle
these balances on a net basis under normal
circumstances, they do not qualify for net
presentation for accounting purposes.
We increased our exposure to cash and balances
at central banks in 2011, as discussed above,
reflecting the placement of excess liquidity with
central banks in Europe and North America.
Our exposure to derivatives increased in 2011,
mainly in Europe reflecting an increase in the fair
value of interest rate contracts. This was
compounded by an increase in the notional value of
outstanding contracts, partly offset by higher netting
which rose in line with the increase in fair values.
Despite the increase in maximum exposure, our net
exposure to derivatives in 2011 decreased due to a
rise in the derivative offset.
The derivative offset amount in the table on
page 107 relates to exposures where the counterparty
has an offsetting derivative exposure with HSBC, a
master netting arrangement is in place and the credit
risk exposure is managed on a net basis or the
position is specifically collateralised, normally in the
form of cash. At 31 December 2011, the total amount
of such offsets was US$306bn (2010: US$198bn), of
which US$272bn (2010: US$178bn) were offsets
under a master netting arrangement, US$33.0bn
(2010: US$19.1bn) were collateral received in
cash and US$0.7bn (2010: US$0.2bn) were other
collateral. These amounts do not qualify for net
presentation for accounting purposes as settlement
may not actually be made on a net basis.
During 2011, we decreased our exposure to
trading assets. This reflected a reduction in our
holdings of government and highly-rated corporate
debt securities and equity positions, notably in
Europe. In addition, our reverse repo exposure
declined in North America as we did not replace
maturities.
In 2011, our loss experience continued to be
dominated by the personal lending portfolios, with
some 77% of our loan impairment charges related to
this lending category of which 56% was related to
US personal lending. This compared with 80% in
2010, of which 57% was related to US personal
lending.
While not considered as offset in the table
below, other arrangements including short positions
in securities and financial assets held as part of
linked insurance/investment contracts where the risk
is predominately borne by the policyholder, reduce
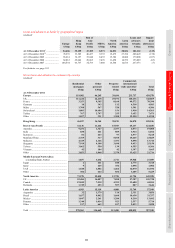
our maximum exposure to credit risk. In addition,
we hold collateral in respect of individual loans and
advances (see page 144).