HSBC 2011 Annual Report Download - page 72
Download and view the complete annual report
Please find page 72 of the 2011 HSBC annual report below. You can navigate through the pages in the report by either clicking on the pages listed below, or by using the keyword search tool below to find specific information within the annual report.-
 1
1 -
2
-
3
-
4
-
5
-
6
-
7
-
8
-
9
-
10
-
11
-
12
-
13
-
14
-
15
-
16
-
17
-
18
-
19
-
20
-
21
-
22
-
23
-
24
-
25
-
26
-
27
-
28
-
29
-
30
-
31
-
32
-
33
-
34
-
35
-
36
-
37
-
38
-
39
-
40
-
41
-
42
-
43
-
44
-
45
-
46
-
47
-
48
-
49
-
50
-
51
-
52
-
53
-
54
-
55
-
56
-
57
-
58
-
59
-
60
-
61
-
 62
62 -
 63
63 -
 64
64 -
 65
65 -
 66
66 -
 67
67 -
 68
68 -
 69
69 -
 70
70 -
 71
71 -
 72
72 -
 73
73 -
 74
74 -
 75
75 -
 76
76 -
 77
77 -
 78
78 -
 79
79 -
 80
80 -
 81
81 -
 82
82 -
83
-
84
-
85
-
86
-
87
-
88
-
89
-
90
-
91
-
92
-
93
-
94
-
95
-
96
-
97
-
98
-
99
-
100
-
101
-
102
-
103
-
104
-
105
-
106
-
107
-
108
-
109
-
110
-
111
-
112
-
113
-
114
-
115
-
116
-
117
-
118
-
119
-
120
-
121
-
122
-
123
-
124
-
125
-
126
-
127
-
128
-
129
-
130
-
131
-
132
-
133
-
134
-
135
-
136
-
137
-
138
-
139
-
140
-
141
-
142
-
143
-
144
-
145
-
146
-
147
-
148
-
149
-
150
-
151
-
152
-
153
-
154
-
155
-
156
-
157
-
158
-
159
-
160
-
161
-
162
-
163
-
164
-
165
-
166
-
167
-
168
-
169
-
170
-
171
-
172
-
173
-
174
-
175
-
176
-
177
-
178
-
179
-
180
-
181
-
182
-
183
-
184
-
185
-
186
-
187
-
188
-
189
-
190
-
191
-
192
-
193
-
194
-
195
-
196
-
197
-
198
-
199
-
200
-
201
-
202
-
203
-
204
-
205
-
206
-
207
-
208
-
209
-
210
-
211
-
212
-
213
-
214
-
215
-
216
-
217
-
218
-
219
-
220
-
221
-
222
-
223
-
224
-
225
-
226
-
227
-
228
-
229
-
230
-
231
-
232
-
233
-
234
-
235
-
236
-
237
-
238
-
239
-
240
-
241
-
242
-
243
-
244
-
245
-
246
-
247
-
248
-
249
-
250
-
251
-
252
-
253
-
254
-
255
-
256
-
257
-
258
-
259
-
260
-
261
-
262
-
263
-
264
-
265
-
266
-
267
-
268
-
269
-
270
-
271
-
272
-
273
-
274
-
275
-
276
-
277
-
278
-
279
-
280
-
281
-
282
-
283
-
284
-
285
-
286
-
287
-
288
-
289
-
290
-
291
-
292
-
293
-
294
-
295
-
296
-
297
-
298
-
299
-
300
-
301
-
302
-
303
-
304
-
305
-
306
-
307
-
308
-
309
-
310
-
311
-
312
-
313
-
314
-
315
-
316
-
317
-
318
-
319
-
320
-
321
-
322
-
323
-
324
-
325
-
326
-
327
-
328
-
329
-
330
-
331
-
332
-
333
-
334
-
335
-
336
-
337
-
338
-
339
-
340
-
341
-
342
-
343
-
344
-
345
-
346
-
347
-
348
-
349
-
350
-
351
-
352
-
353
-
354
-
355
-
356
-
357
-
358
-
359
-
360
-
361
-
362
-
363
-
364
-
365
-
366
-
367
-
368
-
369
-
370
-
371
-
372
-
373
-
374
-
375
-
376
-
377
-
378
-
379
-
380
-
381
-
382
-
383
-
384
-
385
-
386
-
387
-
388
-
389
-
390
-
391
-
392
-
393
-
394
-
395
-
396
-
397
-
398
-
399
-
400
-
401
-
402
-
403
-
404
-
405
-
406
-
407
-
408
-
409
-
410
-
411
-
412
-
413
-
414
-
415
-
416
-
417
-
418
-
419
-
420
-
421
-
422
-
423
-
424
-
425
-
426
-
427
-
428
-
429
-
430
-
431
-
432
-
433
-
434
-
435
-
436
-
437
-
438
-
439
-
440
 |
 |

HSBC HOLDINGS PLC
Report of the Directors: Operating and Financial Review (continued)
Geographical regions > Hong Kong / Rest of Asia-Pacific
70
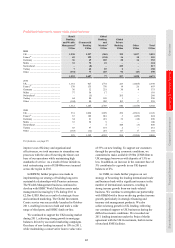
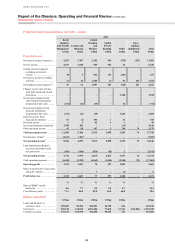
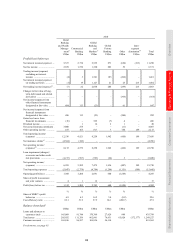
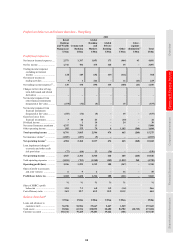
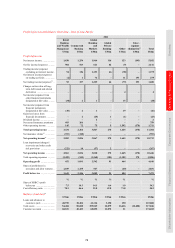
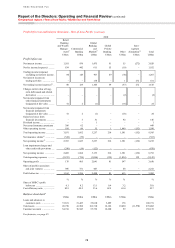
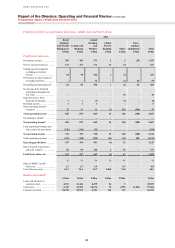
Profit/(loss) before tax and balance sheet data – Hong Kong (continued)
2010
Retail
Banking
and Wealth
Manage-
ment17
US$m
Commercial
Banking
US$m
Global
Banking
and
Markets17
US$m
Global
Private
Banking
US$m
Other
US$m
Inter-
segment
elimination64
US$m
Total
US$m
Profit/(loss) before tax
Net interest income/(expense) .... 2,604 1,106 915 173 (463) (89) 4,246
Net fee income ............................ 1,656 634 495 163 14 – 2,962
Trading income/(expense)
excluding net interest
income .................................... 198 121 680 120 (12) – 1,107
Net interest income on
trading activities ..................... 4 – 100 – 12 89 205
Net trading income56 ................... 202 121 780 120 – 89 1,312
Changes in fair value of long-
term debt issued and related
derivatives .............................. – – – – (2) – (2)
Net income/(expense) from
other financial instruments
designated at fair value ........... 328 (10) 61 – 1 – 380
Net income/(expense) from
financial instruments
designated at fair value ........... 328 (10) 61 – (1) – 378
Gains less losses from
financial investments .............. – – 56 1 41 – 98
Dividend income ......................... – 1 12 – 17 – 30
Net earned insurance premiums . 3,655 665 12 – – – 4,332
Other operating income .............. 513 68 156 12 1,140 (283) 1,606
Total operating income ............... 8,958 2,585 2,487 469 748 (283) 14,964
Net insurance claims65 ................ (4,193) (559) (10) – – – (4,762)
Net operating income52 ............... 4,765 2,026 2,477 469 748 (283) 10,202
Loan impairment charges and
other credit risk provisions ..... (76) (28) (10) – – – (114)
Net operating income ................. 4,689 1,998 2,467 469 748 (283) 10,088
Total operating expenses ............ (1,693) (653) (1,124) (242) (1,002) 283 (4,431)
Operating profit/(loss) ................ 2,996 1,345 1,343 227 (254) – 5,657
Share of profit in associates
and joint ventures ................... 5 7 4 – 19 – 35
Profit/(loss) before tax ................ 3,001 1,352 1,347 227 (235) – 5,692
% % % % % %
Share of HSBC’s profit
before tax ................................ 15.7 7.1 7.1 1.2 (1.2) 29.9
Cost efficiency ratio ................... 35.5 32.2 45.4 51.6 134.0 43.4
Balance sheet data49
US$m US$m US$m US$m US$m US$m
Loans and advances to
customers (net) ....................... 50,983 48,670 34,491 4,760 1,787 140,691
Total assets68 ............................... 76,871 55,030 223,286 20,598 62,486 (8,706) 429,565
Customer accounts ...................... 176,960 71,209 29,388 19,241 686 297,484
For footnotes, see page 95.