HSBC 2011 Annual Report Download - page 170
Download and view the complete annual report
Please find page 170 of the 2011 HSBC annual report below. You can navigate through the pages in the report by either clicking on the pages listed below, or by using the keyword search tool below to find specific information within the annual report.-
 1
1 -
2
-
3
-
4
-
5
-
6
-
7
-
8
-
9
-
10
-
11
-
12
-
13
-
14
-
15
-
16
-
17
-
18
-
19
-
20
-
21
-
22
-
23
-
24
-
25
-
26
-
27
-
28
-
29
-
30
-
31
-
32
-
33
-
34
-
35
-
36
-
37
-
38
-
39
-
40
-
41
-
42
-
43
-
44
-
45
-
46
-
47
-
48
-
49
-
50
-
51
-
52
-
53
-
54
-
55
-
56
-
57
-
58
-
59
-
60
-
61
-
62
-
63
-
64
-
65
-
66
-
67
-
68
-
69
-
70
-
71
-
72
-
73
-
74
-
75
-
76
-
77
-
78
-
79
-
80
-
81
-
82
-
83
-
84
-
85
-
86
-
87
-
88
-
89
-
90
-
91
-
92
-
93
-
94
-
95
-
96
-
97
-
98
-
99
-
100
-
101
-
102
-
103
-
104
-
105
-
106
-
107
-
108
-
109
-
110
-
111
-
112
-
113
-
114
-
115
-
116
-
117
-
118
-
119
-
120
-
121
-
122
-
123
-
124
-
125
-
126
-
127
-
128
-
129
-
130
-
131
-
132
-
133
-
134
-
135
-
136
-
137
-
138
-
139
-
140
-
141
-
142
-
143
-
144
-
145
-
146
-
147
-
148
-
149
-
150
-
151
-
152
-
153
-
154
-
155
-
156
-
157
-
158
-
159
-
 160
160 -
 161
161 -
 162
162 -
 163
163 -
 164
164 -
 165
165 -
 166
166 -
 167
167 -
 168
168 -
 169
169 -
 170
170 -
 171
171 -
 172
172 -
 173
173 -
 174
174 -
 175
175 -
 176
176 -
 177
177 -
 178
178 -
 179
179 -
 180
180 -
181
-
182
-
183
-
184
-
185
-
186
-
187
-
188
-
189
-
190
-
191
-
192
-
193
-
194
-
195
-
196
-
197
-
198
-
199
-
200
-
201
-
202
-
203
-
204
-
205
-
206
-
207
-
208
-
209
-
210
-
211
-
212
-
213
-
214
-
215
-
216
-
217
-
218
-
219
-
220
-
221
-
222
-
223
-
224
-
225
-
226
-
227
-
228
-
229
-
230
-
231
-
232
-
233
-
234
-
235
-
236
-
237
-
238
-
239
-
240
-
241
-
242
-
243
-
244
-
245
-
246
-
247
-
248
-
249
-
250
-
251
-
252
-
253
-
254
-
255
-
256
-
257
-
258
-
259
-
260
-
261
-
262
-
263
-
264
-
265
-
266
-
267
-
268
-
269
-
270
-
271
-
272
-
273
-
274
-
275
-
276
-
277
-
278
-
279
-
280
-
281
-
282
-
283
-
284
-
285
-
286
-
287
-
288
-
289
-
290
-
291
-
292
-
293
-
294
-
295
-
296
-
297
-
298
-
299
-
300
-
301
-
302
-
303
-
304
-
305
-
306
-
307
-
308
-
309
-
310
-
311
-
312
-
313
-
314
-
315
-
316
-
317
-
318
-
319
-
320
-
321
-
322
-
323
-
324
-
325
-
326
-
327
-
328
-
329
-
330
-
331
-
332
-
333
-
334
-
335
-
336
-
337
-
338
-
339
-
340
-
341
-
342
-
343
-
344
-
345
-
346
-
347
-
348
-
349
-
350
-
351
-
352
-
353
-
354
-
355
-
356
-
357
-
358
-
359
-
360
-
361
-
362
-
363
-
364
-
365
-
366
-
367
-
368
-
369
-
370
-
371
-
372
-
373
-
374
-
375
-
376
-
377
-
378
-
379
-
380
-
381
-
382
-
383
-
384
-
385
-
386
-
387
-
388
-
389
-
390
-
391
-
392
-
393
-
394
-
395
-
396
-
397
-
398
-
399
-
400
-
401
-
402
-
403
-
404
-
405
-
406
-
407
-
408
-
409
-
410
-
411
-
412
-
413
-
414
-
415
-
416
-
417
-
418
-
419
-
420
-
421
-
422
-
423
-
424
-
425
-
426
-
427
-
428
-
429
-
430
-
431
-
432
-
433
-
434
-
435
-
436
-
437
-
438
-
439
-
440
 |
 |

HSBC HOLDINGS PLC
Report of the Directors: Operating and Financial Review (continued)
Risk > Market risk > Additional market risk measures
168
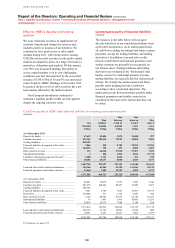
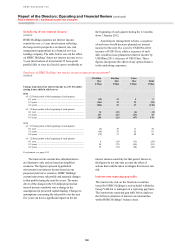
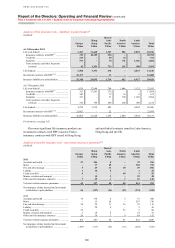
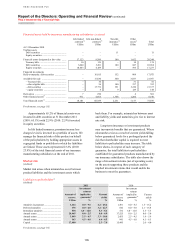
Sensitivity of net interest income
(Audited)
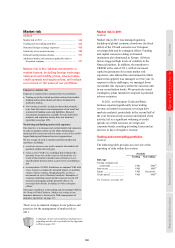
HSBC Holdings monitors net interest income
sensitivity over a 5-year time horizon reflecting
the longer-term perspective on interest rate risk
management appropriate to a financial services
holding company. The table below sets out the effect
on HSBC Holdings’ future net interest income over a
5-year time horizon of incremental 25 basis point
parallel falls or rises in all yield curves worldwide at
the beginning of each quarter during the 12 months
from 1 January 2012.
Assuming no management actions, a sequence
of such rises would decrease planned net interest
income for the next five years by US$269m (2011:
increase of US$155m), while a sequence of such
falls would increase planned net interest income by
US$248m (2011: decrease of US$155m). These
figures incorporate the effect of any option features
in the underlying exposures.
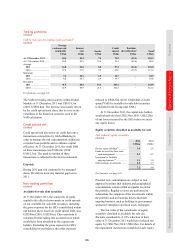
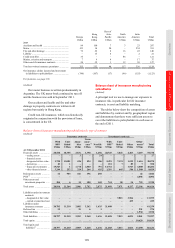
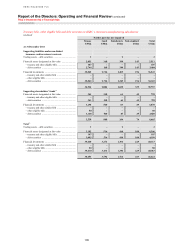
Sensitivity of HSBC Holdings’ net interest income to interest rate movements65
(Audited)
US dollar
bloc
Sterling
bloc
Euro
bloc
Total
US$m US$m US$m US$m
Change in projected net interest income as at 31 December
arising from a shift in yield curves
2011
of + 25 basis points at the beginning of each quarter
0-1 year ................................................................................. (13) 11 4 2
2-3 years ............................................................................... (161) 33 33 (95)
4-5 years ............................................................................... (244) 21 47 (176)
of – 25 basis points at the beginning of each quarter
0-1 year ................................................................................. 14 (11) (4) (1)
2-3 years ............................................................................... 127 (27) (27) 73
4-5 years ............................................................................... 244 (21) (47) 176
2010
of + 25 basis points at the beginning of each quarter
0-1 year ................................................................................. (6) 19 11 24
2-3 years ............................................................................... (56) 75 62 81
4-5 years ............................................................................... (79) 71 58 50
of – 25 basis points at the beginning of each quarter
0-1 year ................................................................................. 6 (19) (11) (24)
2-3 years ............................................................................... 56 (75) (62) (81)
4-5 years ............................................................................... 79 (71) (58) (50)
For footnote, see page 185.
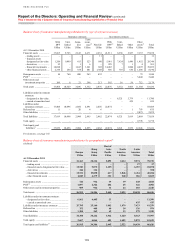
The interest rate sensitivities tabulated above
are illustrative only and are based on simplified
scenarios. The figures represent hypothetical
movements in net interest income based on our
projected yield curve scenarios, HSBC Holdings’
current interest rate risk profile and assumed changes
to that profile during the next five years. The main
driver of the change in the US dollar projected net
interest income sensitivity was a change in the
assumptions for projected capital funding. Changes to
assumptions concerning the risk profile over the next
five years can have a significant impact on the net
interest income sensitivity for that period. However,
the figures do not take into account the effect of
actions that could be taken to mitigate this interest rate
risk.
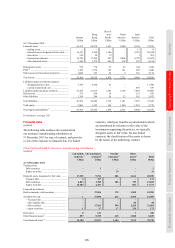
Interest rate repricing gap table
The interest rate risk on the fixed-rate securities
issued by HSBC Holdings is not included within the
Group VAR but is managed on a repricing gap basis.
The interest rate repricing gap table below analyses
the full-term structure of interest rate mismatches
within HSBC Holdings’ balance sheet.