HSBC 2011 Annual Report Download - page 129
Download and view the complete annual report
Please find page 129 of the 2011 HSBC annual report below. You can navigate through the pages in the report by either clicking on the pages listed below, or by using the keyword search tool below to find specific information within the annual report.-
 1
1 -
2
-
3
-
4
-
5
-
6
-
7
-
8
-
9
-
10
-
11
-
12
-
13
-
14
-
15
-
16
-
17
-
18
-
19
-
20
-
21
-
22
-
23
-
24
-
25
-
26
-
27
-
28
-
29
-
30
-
31
-
32
-
33
-
34
-
35
-
36
-
37
-
38
-
39
-
40
-
41
-
42
-
43
-
44
-
45
-
46
-
47
-
48
-
49
-
50
-
51
-
52
-
53
-
54
-
55
-
56
-
57
-
58
-
59
-
60
-
61
-
62
-
63
-
64
-
65
-
66
-
67
-
68
-
69
-
70
-
71
-
72
-
73
-
74
-
75
-
76
-
77
-
78
-
79
-
80
-
81
-
82
-
83
-
84
-
85
-
86
-
87
-
88
-
89
-
90
-
91
-
92
-
93
-
94
-
95
-
96
-
97
-
98
-
99
-
100
-
101
-
102
-
103
-
104
-
105
-
106
-
107
-
108
-
109
-
110
-
111
-
112
-
113
-
114
-
115
-
116
-
117
-
118
-
 119
119 -
 120
120 -
 121
121 -
 122
122 -
 123
123 -
 124
124 -
 125
125 -
 126
126 -
 127
127 -
 128
128 -
 129
129 -
 130
130 -
 131
131 -
 132
132 -
 133
133 -
 134
134 -
 135
135 -
 136
136 -
 137
137 -
 138
138 -
 139
139 -
140
-
141
-
142
-
143
-
144
-
145
-
146
-
147
-
148
-
149
-
150
-
151
-
152
-
153
-
154
-
155
-
156
-
157
-
158
-
159
-
160
-
161
-
162
-
163
-
164
-
165
-
166
-
167
-
168
-
169
-
170
-
171
-
172
-
173
-
174
-
175
-
176
-
177
-
178
-
179
-
180
-
181
-
182
-
183
-
184
-
185
-
186
-
187
-
188
-
189
-
190
-
191
-
192
-
193
-
194
-
195
-
196
-
197
-
198
-
199
-
200
-
201
-
202
-
203
-
204
-
205
-
206
-
207
-
208
-
209
-
210
-
211
-
212
-
213
-
214
-
215
-
216
-
217
-
218
-
219
-
220
-
221
-
222
-
223
-
224
-
225
-
226
-
227
-
228
-
229
-
230
-
231
-
232
-
233
-
234
-
235
-
236
-
237
-
238
-
239
-
240
-
241
-
242
-
243
-
244
-
245
-
246
-
247
-
248
-
249
-
250
-
251
-
252
-
253
-
254
-
255
-
256
-
257
-
258
-
259
-
260
-
261
-
262
-
263
-
264
-
265
-
266
-
267
-
268
-
269
-
270
-
271
-
272
-
273
-
274
-
275
-
276
-
277
-
278
-
279
-
280
-
281
-
282
-
283
-
284
-
285
-
286
-
287
-
288
-
289
-
290
-
291
-
292
-
293
-
294
-
295
-
296
-
297
-
298
-
299
-
300
-
301
-
302
-
303
-
304
-
305
-
306
-
307
-
308
-
309
-
310
-
311
-
312
-
313
-
314
-
315
-
316
-
317
-
318
-
319
-
320
-
321
-
322
-
323
-
324
-
325
-
326
-
327
-
328
-
329
-
330
-
331
-
332
-
333
-
334
-
335
-
336
-
337
-
338
-
339
-
340
-
341
-
342
-
343
-
344
-
345
-
346
-
347
-
348
-
349
-
350
-
351
-
352
-
353
-
354
-
355
-
356
-
357
-
358
-
359
-
360
-
361
-
362
-
363
-
364
-
365
-
366
-
367
-
368
-
369
-
370
-
371
-
372
-
373
-
374
-
375
-
376
-
377
-
378
-
379
-
380
-
381
-
382
-
383
-
384
-
385
-
386
-
387
-
388
-
389
-
390
-
391
-
392
-
393
-
394
-
395
-
396
-
397
-
398
-
399
-
400
-
401
-
402
-
403
-
404
-
405
-
406
-
407
-
408
-
409
-
410
-
411
-
412
-
413
-
414
-
415
-
416
-
417
-
418
-
419
-
420
-
421
-
422
-
423
-
424
-
425
-
426
-
427
-
428
-
429
-
430
-
431
-
432
-
433
-
434
-
435
-
436
-
437
-
438
-
439
-
440
 |
 |
127
Overview Operating & Financial Review Corporate Governance Financial Statements Shareholder Information
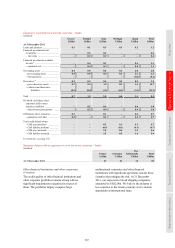
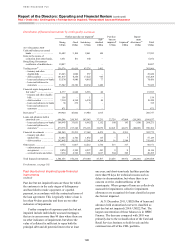
with central banks considered strong, the proportion
of balances classified as strong increased from 90%
to 98%.
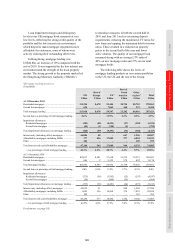
Loans and advances held at amortised cost, on
which credit quality has been assessed, decreased by
4% to US$1,121bn. The decline was mainly in North
America, following the reclassification of certain
lending balances to assets held for sale. Despite the
reclassification of balances, the proportion of the
Group’s loans and advances held at amortised cost
and categorised as strong and good were broadly
in line with the end of 2010, at 54% and 22%
respectively.
Trading assets, on which credit quality has
been assessed, decreased by 10% to US$309bn
in 2011. This reflected a reduction in our holdings
of government and highly-rated corporate debt
securities and equity positions, notably in Europe.
Despite the decline in balances, the proportion of
balances classified as strong remained stable at 75%.
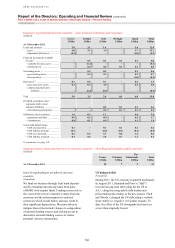
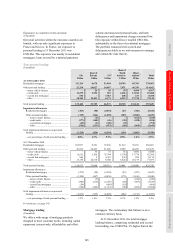
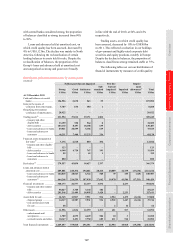
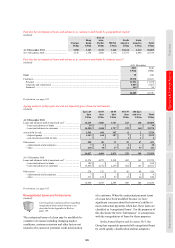
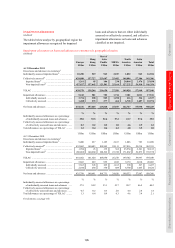
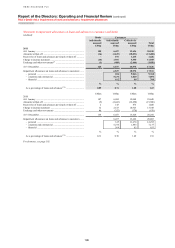
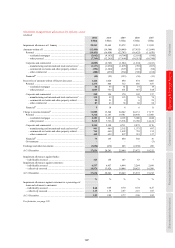
The following tables set out our distribution of
financial instruments by measures of credit quality:
Distribution of financial instruments by credit quality
(Audited)
Neither past due nor impaired Past due Impair-
Strong
Good Satisfactory
Sub-
standard
but not
impaired Impaired
ment
allowances19 To t a l
US$m US$m US$m US$m US$m US$m US$m US$m
At 31 December 2011
Cash and balances at central
banks .................................... 126,926 2,678 263 35 129,902
Items in the course of
collection from other banks.. 7,707 150 350 1 8,208
Hong Kong Government
certificates of indebtedness .. 20,922 – – – 20,922
Trading assets20 ........................ 231,594 37,182 39,171 1,502 309,449
– treasury and other
eligible bills ...................... 33,199 538 564 8 34,309
– debt securities ................... 103,163 8,497 18,188 639 130,487
– loans and advances to banks 49,021 20,699 5,186 619 75,525
– loans and advances to
customers .......................... 46,211 7,448 15,233 236 69,128
Financial assets designated at
fair value20 ........................... 7,176 4,728 830 192 12,926
– treasury and other eligible
bills ................................... 123 – – – 123
– debt securities ................... 6,148 4,728 767 191 11,834
– loans and advances to banks 55 – 63 1 119
– loans and advances to
customers .......................... 850 – – – 850
Derivatives20 ............................ 279,557 45,858 18,627 2,337 346,379
Loans and advances held at
amortised cost ...................... 609,081 245,352 194,661 28,210 20,009 41,739 (17,636) 1,121,416
– loans and advances to banks 144,815 28,813 6,722 568 39 155 (125) 180,987
– loans and advances to
customers21 ....................... 464,266 216,539 187,939 27,642 19,970 41,584 (17,511) 940,429
Financial investments .............. 340,173 24,757 22,139 3,532 – 2,233 392,834
– treasury and other similar
bills ................................... 58,627 3,348 3,144 104 –– 65,223
– debt securities ................... 281,546 21,409 18,995 3,428 –2,233 327,611
Assets held for sale .................. 14,365 12,587 7,931 536 2,524 1,479 (1,614) 37,808
– disposal groups ................. 14,317 12,587 7,931 536 2,522 1,467 (1,614) 37,746
– non-current assets held
for sale .............................. 48 – – – 2 12 – 62
Other assets .............................. 11,956 6,526 12,379 1,193 421 517 32,992
– endorsements and
acceptances ....................... 1,789 4,075 4,629 504 10 3 11,010
– accrued income and other . 10,167 2,451 7,750 689 411 514 21,982
Total financial instruments ...... 1,649,457 379,818 296,351 37,538 22,954 45,968 (19,250) 2,412,836