HSBC 2011 Annual Report Download - page 281
Download and view the complete annual report
Please find page 281 of the 2011 HSBC annual report below. You can navigate through the pages in the report by either clicking on the pages listed below, or by using the keyword search tool below to find specific information within the annual report.-
 1
1 -
2
-
3
-
4
-
5
-
6
-
7
-
8
-
9
-
10
-
11
-
12
-
13
-
14
-
15
-
16
-
17
-
18
-
19
-
20
-
21
-
22
-
23
-
24
-
25
-
26
-
27
-
28
-
29
-
30
-
31
-
32
-
33
-
34
-
35
-
36
-
37
-
38
-
39
-
40
-
41
-
42
-
43
-
44
-
45
-
46
-
47
-
48
-
49
-
50
-
51
-
52
-
53
-
54
-
55
-
56
-
57
-
58
-
59
-
60
-
61
-
62
-
63
-
64
-
65
-
66
-
67
-
68
-
69
-
70
-
71
-
72
-
73
-
74
-
75
-
76
-
77
-
78
-
79
-
80
-
81
-
82
-
83
-
84
-
85
-
86
-
87
-
88
-
89
-
90
-
91
-
92
-
93
-
94
-
95
-
96
-
97
-
98
-
99
-
100
-
101
-
102
-
103
-
104
-
105
-
106
-
107
-
108
-
109
-
110
-
111
-
112
-
113
-
114
-
115
-
116
-
117
-
118
-
119
-
120
-
121
-
122
-
123
-
124
-
125
-
126
-
127
-
128
-
129
-
130
-
131
-
132
-
133
-
134
-
135
-
136
-
137
-
138
-
139
-
140
-
141
-
142
-
143
-
144
-
145
-
146
-
147
-
148
-
149
-
150
-
151
-
152
-
153
-
154
-
155
-
156
-
157
-
158
-
159
-
160
-
161
-
162
-
163
-
164
-
165
-
166
-
167
-
168
-
169
-
170
-
171
-
172
-
173
-
174
-
175
-
176
-
177
-
178
-
179
-
180
-
181
-
182
-
183
-
184
-
185
-
186
-
187
-
188
-
189
-
190
-
191
-
192
-
193
-
194
-
195
-
196
-
197
-
198
-
199
-
200
-
201
-
202
-
203
-
204
-
205
-
206
-
207
-
208
-
209
-
210
-
211
-
212
-
213
-
214
-
215
-
216
-
217
-
218
-
219
-
220
-
221
-
222
-
223
-
224
-
225
-
226
-
227
-
228
-
229
-
230
-
231
-
232
-
233
-
234
-
235
-
236
-
237
-
238
-
239
-
240
-
241
-
242
-
243
-
244
-
245
-
246
-
247
-
248
-
249
-
250
-
251
-
252
-
253
-
254
-
255
-
256
-
257
-
258
-
259
-
260
-
261
-
262
-
263
-
264
-
265
-
266
-
267
-
268
-
269
-
270
-
 271
271 -
 272
272 -
 273
273 -
 274
274 -
 275
275 -
 276
276 -
 277
277 -
 278
278 -
 279
279 -
 280
280 -
 281
281 -
 282
282 -
 283
283 -
 284
284 -
 285
285 -
 286
286 -
 287
287 -
 288
288 -
 289
289 -
 290
290 -
 291
291 -
292
-
293
-
294
-
295
-
296
-
297
-
298
-
299
-
300
-
301
-
302
-
303
-
304
-
305
-
306
-
307
-
308
-
309
-
310
-
311
-
312
-
313
-
314
-
315
-
316
-
317
-
318
-
319
-
320
-
321
-
322
-
323
-
324
-
325
-
326
-
327
-
328
-
329
-
330
-
331
-
332
-
333
-
334
-
335
-
336
-
337
-
338
-
339
-
340
-
341
-
342
-
343
-
344
-
345
-
346
-
347
-
348
-
349
-
350
-
351
-
352
-
353
-
354
-
355
-
356
-
357
-
358
-
359
-
360
-
361
-
362
-
363
-
364
-
365
-
366
-
367
-
368
-
369
-
370
-
371
-
372
-
373
-
374
-
375
-
376
-
377
-
378
-
379
-
380
-
381
-
382
-
383
-
384
-
385
-
386
-
387
-
388
-
389
-
390
-
391
-
392
-
393
-
394
-
395
-
396
-
397
-
398
-
399
-
400
-
401
-
402
-
403
-
404
-
405
-
406
-
407
-
408
-
409
-
410
-
411
-
412
-
413
-
414
-
415
-
416
-
417
-
418
-
419
-
420
-
421
-
422
-
423
-
424
-
425
-
426
-
427
-
428
-
429
-
430
-
431
-
432
-
433
-
434
-
435
-
436
-
437
-
438
-
439
-
440
 |
 |

279
Overview Operating & Financial Review Corporate Governance Financial Statements Shareholder Information
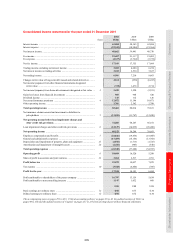
Consolidated income statement for the year ended 31 December 2011
2011 2010 2009
Notes US$m US$m US$m
Interest income ................................................................................................ 63,005 58,345 62,096
Interest expense ............................................................................................... (22,343) (18,904) (21,366)
Net interest income .......................................................................................... 40,662 39,441 40,730
Fee income ....................................................................................................... 21,497 21,117 21,403
Fee expense ...................................................................................................... (4,337) (3,762) (3,739)
Net fee income ................................................................................................. 17,160 17,355 17,664
Trading income excluding net interest income ............................................... 3,283 4,680 6,236
Net interest income on trading activities ......................................................... 3,223 2,530 3,627
Net trading income .......................................................................................... 6,506 7,210 9,863
Changes in fair value of long-term debt issued and related derivatives ......... 4,161 (258) (6,247)
Net income/(expense) from other financial instruments designated
at fair value ................................................................................................. (722) 1,478 2,716
Net income/(expense) from financial instruments designated at fair value ... 3 3,439 1,220 (3,531)
Gains less losses from financial investments .................................................. 907 968 520
Dividend income .............................................................................................. 149 112 126
Net earned insurance premiums ...................................................................... 4 12,872 11,146 10,471
Other operating income ................................................................................... 1,766 2,562 2,788
Total operating income ................................................................................. 83,461 80,014 78,631
Net insurance claims incurred and movement in liabilities to
policyholders .............................................................................................. 5 (11,181) (11,767) (12,450)
Net operating income before loan impairment charges and
other credit risk provisions ...................................................................... 72,280 68,247 66,181
Loan impairment charges and other credit risk provisions ............................. 6 (12,127) (14,039) (26,488)
Net operating income .................................................................................... 60,153 54,208 39,693
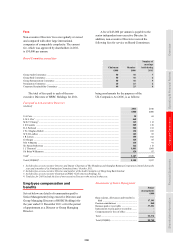
Employee compensation and benefits ............................................................. 7 (21,166) (19,836) (18,468)
General and administrative expenses .............................................................. (17,459) (15,156) (13,392)
Depreciation and impairment of property, plant and equipment .................... 25 (1,570) (1,713) (1,725)
Amortisation and impairment of intangible assets .......................................... 24 (1,350) (983) (810)
Total operating expenses ............................................................................... (41,545) (37,688) (34,395)
Operating profit ............................................................................................. 6 18,608 16,520 5,298
Share of profit in associates and joint ventures ............................................... 23 3,264 2,517 1,781
Profit before tax ............................................................................................. 21,872 19,037 7,079
Tax expense ..................................................................................................... 10 (3,928) (4,846) (385)
Profit for the year .......................................................................................... 17,944 14,191 6,694
Profit attributable to shareholders of the parent company .............................. 16,797 13,159 5,834
Profit attributable to non-controlling interests ................................................ 1,147 1,032 860
US$ US$ US$
Basic earnings per ordinary share ................................................................... 12 0.92 0.73 0.34
Diluted earnings per ordinary share ................................................................ 12 0.91 0.72 0.34
The accompanying notes on pages 291 to 413, ‘Critical accounting policies’ on pages 38 to 42, the audited sections of ‘Risk’ on
pages 98 to 210 and the audited sections of ‘Capital’ on pages 211 to 217 form an integral part of these financial statements.