HSBC 2011 Annual Report Download - page 360
Download and view the complete annual report
Please find page 360 of the 2011 HSBC annual report below. You can navigate through the pages in the report by either clicking on the pages listed below, or by using the keyword search tool below to find specific information within the annual report.-
 1
1 -
2
-
3
-
4
-
5
-
6
-
7
-
8
-
9
-
10
-
11
-
12
-
13
-
14
-
15
-
16
-
17
-
18
-
19
-
20
-
21
-
22
-
23
-
24
-
25
-
26
-
27
-
28
-
29
-
30
-
31
-
32
-
33
-
34
-
35
-
36
-
37
-
38
-
39
-
40
-
41
-
42
-
43
-
44
-
45
-
46
-
47
-
48
-
49
-
50
-
51
-
52
-
53
-
54
-
55
-
56
-
57
-
58
-
59
-
60
-
61
-
62
-
63
-
64
-
65
-
66
-
67
-
68
-
69
-
70
-
71
-
72
-
73
-
74
-
75
-
76
-
77
-
78
-
79
-
80
-
81
-
82
-
83
-
84
-
85
-
86
-
87
-
88
-
89
-
90
-
91
-
92
-
93
-
94
-
95
-
96
-
97
-
98
-
99
-
100
-
101
-
102
-
103
-
104
-
105
-
106
-
107
-
108
-
109
-
110
-
111
-
112
-
113
-
114
-
115
-
116
-
117
-
118
-
119
-
120
-
121
-
122
-
123
-
124
-
125
-
126
-
127
-
128
-
129
-
130
-
131
-
132
-
133
-
134
-
135
-
136
-
137
-
138
-
139
-
140
-
141
-
142
-
143
-
144
-
145
-
146
-
147
-
148
-
149
-
150
-
151
-
152
-
153
-
154
-
155
-
156
-
157
-
158
-
159
-
160
-
161
-
162
-
163
-
164
-
165
-
166
-
167
-
168
-
169
-
170
-
171
-
172
-
173
-
174
-
175
-
176
-
177
-
178
-
179
-
180
-
181
-
182
-
183
-
184
-
185
-
186
-
187
-
188
-
189
-
190
-
191
-
192
-
193
-
194
-
195
-
196
-
197
-
198
-
199
-
200
-
201
-
202
-
203
-
204
-
205
-
206
-
207
-
208
-
209
-
210
-
211
-
212
-
213
-
214
-
215
-
216
-
217
-
218
-
219
-
220
-
221
-
222
-
223
-
224
-
225
-
226
-
227
-
228
-
229
-
230
-
231
-
232
-
233
-
234
-
235
-
236
-
237
-
238
-
239
-
240
-
241
-
242
-
243
-
244
-
245
-
246
-
247
-
248
-
249
-
250
-
251
-
252
-
253
-
254
-
255
-
256
-
257
-
258
-
259
-
260
-
261
-
262
-
263
-
264
-
265
-
266
-
267
-
268
-
269
-
270
-
271
-
272
-
273
-
274
-
275
-
276
-
277
-
278
-
279
-
280
-
281
-
282
-
283
-
284
-
285
-
286
-
287
-
288
-
289
-
290
-
291
-
292
-
293
-
294
-
295
-
296
-
297
-
298
-
299
-
300
-
301
-
302
-
303
-
304
-
305
-
306
-
307
-
308
-
309
-
310
-
311
-
312
-
313
-
314
-
315
-
316
-
317
-
318
-
319
-
320
-
321
-
322
-
323
-
324
-
325
-
326
-
327
-
328
-
329
-
330
-
331
-
332
-
333
-
334
-
335
-
336
-
337
-
338
-
339
-
340
-
341
-
342
-
343
-
344
-
345
-
346
-
347
-
348
-
349
-
 350
350 -
 351
351 -
 352
352 -
 353
353 -
 354
354 -
 355
355 -
 356
356 -
 357
357 -
 358
358 -
 359
359 -
 360
360 -
 361
361 -
 362
362 -
 363
363 -
 364
364 -
 365
365 -
 366
366 -
 367
367 -
 368
368 -
 369
369 -
 370
370 -
371
-
372
-
373
-
374
-
375
-
376
-
377
-
378
-
379
-
380
-
381
-
382
-
383
-
384
-
385
-
386
-
387
-
388
-
389
-
390
-
391
-
392
-
393
-
394
-
395
-
396
-
397
-
398
-
399
-
400
-
401
-
402
-
403
-
404
-
405
-
406
-
407
-
408
-
409
-
410
-
411
-
412
-
413
-
414
-
415
-
416
-
417
-
418
-
419
-
420
-
421
-
422
-
423
-
424
-
425
-
426
-
427
-
428
-
429
-
430
-
431
-
432
-
433
-
434
-
435
-
436
-
437
-
438
-
439
-
440
 |
 |

HSBC HOLDINGS PLC
Notes on the Financial Statements (continued)
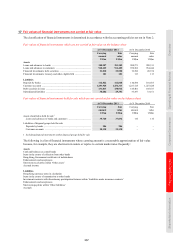
17 – Fair values of financial instruments not carried at fair value / 18 – Reclassification of financial assets
358
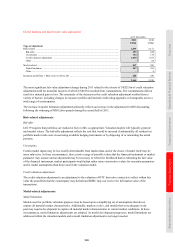
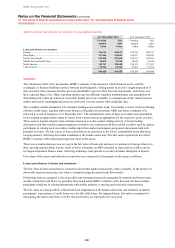
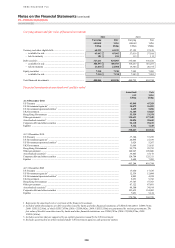
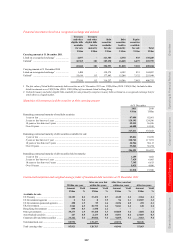
Analysis of loans and advances to customers by geographical segment
At 31 December 2011 At 31 December 2010
Carrying
amount
Fair
value
Carrying
amount
Fair
value
US$m US$m US$m US$m
Loans and advances to customers
Europe ....................................................................................................... 434,336 426,039 435,799 430,333
Hong Kong ............................................................................................... 157,665 154,054 140,691 140,699
Rest of Asia-Pacific .................................................................................. 123,868 123,662 108,731 108,582
Middle East and North Africa .................................................................. 25,875 25,758 24,626 24,539
North America .......................................................................................... 142,747 128,608 190,532 172,522
Latin America ........................................................................................... 55,938 56,364 57,987 57,769
940,429 914,485 958,366 934,444
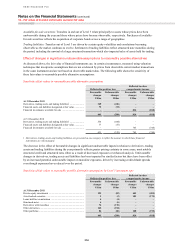
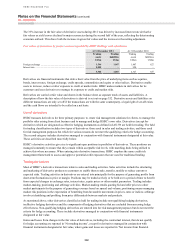
Valuation
The calculation of fair value incorporates HSBC’s estimate of the amount at which financial assets could be
exchanged, or financial liabilities settled, between knowledgeable, willing parties in an arm’s length transaction. It
does not reflect the economic benefits and costs that HSBC expects to flow from the instruments’ cash flows over
their expected future lives. Other reporting entities may use different valuation methodologies and assumptions in
determining fair values for which no observable market prices are available, so comparisons of fair values between
entities may not be meaningful and users are advised to exercise caution when using this data.
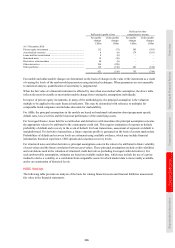
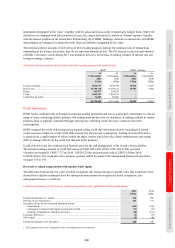
The secondary market demand for US consumer lending assets remains weak. Uncertainty over the extent and timing
of future credit losses, together with a near absence of liquidity for non-prime ABSs and loans, continued to be
reflected in a lack of bid prices at 31 December 2011. The estimated fair value of these receivables was determined
by developing an approximate range of values from various sources as appropriate for the respective pools of assets.
These sources include, internal value estimates based on over-the-counter trading activity, forward looking
discounted cash flow models using assumptions we believe are consistent with those which would be used by market
participants in valuing such receivables trading input from market participants and general discussions held with
potential investors. The fair values of loans and advances to customers in the US are substantially lower than their
carrying amount, reflecting the market conditions at the balance sheet date. The fair values reported do not reflect
HSBC’s estimate of the underlying long-term value of the assets.
There was a modest decrease year on year in the fair value of loans and advances to customers in Europe relative to
their carrying amount which was the result of lower valuations on ABS classified as loans and receivables and on
leveraged acquisition finance loans, reflecting widening credit spreads as a result of market disruption in Europe.
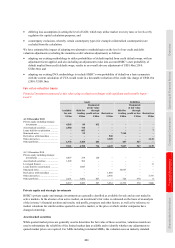
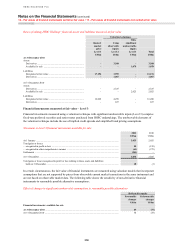
Fair values of the assets and liabilities set out below are estimated for the purpose of disclosure as follows:
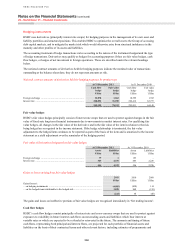
Loans and advances to banks and customers
The fair value of loans and advances is based on observable market transactions, where available. In the absence of
observable market transactions, fair value is estimated using discounted cash flow models.
Performing loans are grouped, as far as possible, into homogeneous pools segregated by maturity and interest rates
and the contractual cash flows are generally discounted using HSBC’s estimate of the discount rate that a market
participant would use in valuing instruments with similar maturity, re-pricing and credit risk characteristics.
The fair value of a loan portfolio reflects both loan impairments at the balance sheet date and estimates of market
participants’ expectations of credit losses over the life of the loans. For impaired loans, fair value is estimated by
discounting the future cash flows over the time period they are expected to be recovered.