HSBC 2011 Annual Report Download - page 162
Download and view the complete annual report
Please find page 162 of the 2011 HSBC annual report below. You can navigate through the pages in the report by either clicking on the pages listed below, or by using the keyword search tool below to find specific information within the annual report.-
 1
1 -
2
-
3
-
4
-
5
-
6
-
7
-
8
-
9
-
10
-
11
-
12
-
13
-
14
-
15
-
16
-
17
-
18
-
19
-
20
-
21
-
22
-
23
-
24
-
25
-
26
-
27
-
28
-
29
-
30
-
31
-
32
-
33
-
34
-
35
-
36
-
37
-
38
-
39
-
40
-
41
-
42
-
43
-
44
-
45
-
46
-
47
-
48
-
49
-
50
-
51
-
52
-
53
-
54
-
55
-
56
-
57
-
58
-
59
-
60
-
61
-
62
-
63
-
64
-
65
-
66
-
67
-
68
-
69
-
70
-
71
-
72
-
73
-
74
-
75
-
76
-
77
-
78
-
79
-
80
-
81
-
82
-
83
-
84
-
85
-
86
-
87
-
88
-
89
-
90
-
91
-
92
-
93
-
94
-
95
-
96
-
97
-
98
-
99
-
100
-
101
-
102
-
103
-
104
-
105
-
106
-
107
-
108
-
109
-
110
-
111
-
112
-
113
-
114
-
115
-
116
-
117
-
118
-
119
-
120
-
121
-
122
-
123
-
124
-
125
-
126
-
127
-
128
-
129
-
130
-
131
-
132
-
133
-
134
-
135
-
136
-
137
-
138
-
139
-
140
-
141
-
142
-
143
-
144
-
145
-
146
-
147
-
148
-
149
-
150
-
151
-
 152
152 -
 153
153 -
 154
154 -
 155
155 -
 156
156 -
 157
157 -
 158
158 -
 159
159 -
 160
160 -
 161
161 -
 162
162 -
 163
163 -
 164
164 -
 165
165 -
 166
166 -
 167
167 -
 168
168 -
 169
169 -
 170
170 -
 171
171 -
 172
172 -
173
-
174
-
175
-
176
-
177
-
178
-
179
-
180
-
181
-
182
-
183
-
184
-
185
-
186
-
187
-
188
-
189
-
190
-
191
-
192
-
193
-
194
-
195
-
196
-
197
-
198
-
199
-
200
-
201
-
202
-
203
-
204
-
205
-
206
-
207
-
208
-
209
-
210
-
211
-
212
-
213
-
214
-
215
-
216
-
217
-
218
-
219
-
220
-
221
-
222
-
223
-
224
-
225
-
226
-
227
-
228
-
229
-
230
-
231
-
232
-
233
-
234
-
235
-
236
-
237
-
238
-
239
-
240
-
241
-
242
-
243
-
244
-
245
-
246
-
247
-
248
-
249
-
250
-
251
-
252
-
253
-
254
-
255
-
256
-
257
-
258
-
259
-
260
-
261
-
262
-
263
-
264
-
265
-
266
-
267
-
268
-
269
-
270
-
271
-
272
-
273
-
274
-
275
-
276
-
277
-
278
-
279
-
280
-
281
-
282
-
283
-
284
-
285
-
286
-
287
-
288
-
289
-
290
-
291
-
292
-
293
-
294
-
295
-
296
-
297
-
298
-
299
-
300
-
301
-
302
-
303
-
304
-
305
-
306
-
307
-
308
-
309
-
310
-
311
-
312
-
313
-
314
-
315
-
316
-
317
-
318
-
319
-
320
-
321
-
322
-
323
-
324
-
325
-
326
-
327
-
328
-
329
-
330
-
331
-
332
-
333
-
334
-
335
-
336
-
337
-
338
-
339
-
340
-
341
-
342
-
343
-
344
-
345
-
346
-
347
-
348
-
349
-
350
-
351
-
352
-
353
-
354
-
355
-
356
-
357
-
358
-
359
-
360
-
361
-
362
-
363
-
364
-
365
-
366
-
367
-
368
-
369
-
370
-
371
-
372
-
373
-
374
-
375
-
376
-
377
-
378
-
379
-
380
-
381
-
382
-
383
-
384
-
385
-
386
-
387
-
388
-
389
-
390
-
391
-
392
-
393
-
394
-
395
-
396
-
397
-
398
-
399
-
400
-
401
-
402
-
403
-
404
-
405
-
406
-
407
-
408
-
409
-
410
-
411
-
412
-
413
-
414
-
415
-
416
-
417
-
418
-
419
-
420
-
421
-
422
-
423
-
424
-
425
-
426
-
427
-
428
-
429
-
430
-
431
-
432
-
433
-
434
-
435
-
436
-
437
-
438
-
439
-
440
 |
 |
HSBC HOLDINGS PLC
Report of the Directors: Operating and Financial Review (continued)
Risk > Liquidity and funding > Management of risk / Encumbered assets / Funding sources / Contingent liquidity risk
160
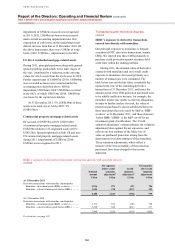
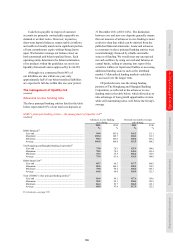
Stressed one month coverage ratio
The stressed one month coverage ratios tabulated
above are derived from projected cash flow scenario
analyses described in the Appendix to Risk on
page 188, and express the stressed cash inflows as
a percentage of stressed cash outflows over a one
month time horizon. Group sites are required to
target a ratio of 100% or more.
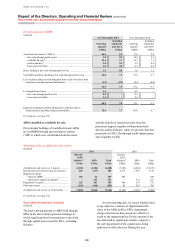
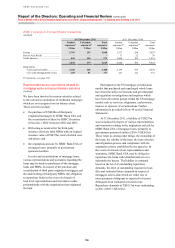
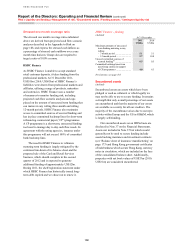
HSBC Finance
As HSBC Finance is unable to accept standard
retail customer deposits, it takes funding from the
professional markets. At 31 December 2011,
US$51bn (2010: US$65bn) of HSBC Finance’s
liabilities were drawn from professional markets and
affiliates, utilising a range of products, maturities
and currencies. HSBC Finance uses a number
of measures to monitor funding risk, including
projected cash flow scenario analysis and caps
placed on the amount of unsecured term funding that
can mature in any rolling three-month and rolling
12-month periods. HSBC Finance also maintains
access to committed sources of secured funding and
has in place committed backstop lines for short-term
refinancing commercial paper (‘CP’) programmes.
A CP programme is a short-term, unsecured funding
tool used to manage day to day cash flow needs. In
agreement with the rating agencies, issuance under
this programme will not exceed 100% of committed
bank backstop lines.
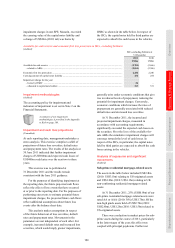
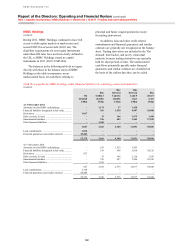
The need for HSBC Finance to refinance
maturing term funding is largely mitigated by the
continued run-down of its balance sheet and the
proposed sale of the Card and Retail Services
business, which should complete in the second
quarter of 2012 and is expected to generate
additional funding of approximately US$12bn.
During 2011, the shelf registration statement under
which HSBC Finance has historically issued long-
term debt expired and we chose not to renew it.
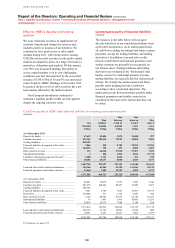
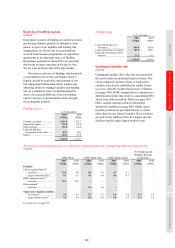
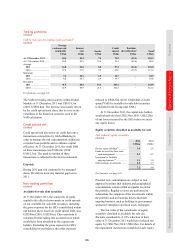
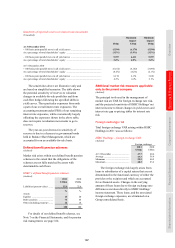
HSBC Finance – funding
(Audited)
At 31 December
2011 2010
US$bn US$bn
Maximum amounts of unsecured
term funding maturing in any
rolling:
– 3 month period ........................... 5.1 5.1
– 12 month period ......................... 9.7 10.8
Unused committed sources of
secured funding48 ........................... 0.5 0.5
Committed backstop lines from
non-Group entities in support
of CP programmes ......................... 4.0 4.3
For footnote, see page 185.
Encumbered assets
(Audited)
Encumbered assets are assets which have been
pledged or used as collateral or which legally we
may not be able to use to secure funding. It remains
a strength that only a small percentage of our assets
are encumbered and that the majority of our assets
are available as security for all our creditors. The
majority of the encumbrance arises due to our repo
activity within Europe and the US in GB&M, which
is largely self-funding.
Our encumbered assets on an IFRSs basis are
disclosed in Note 37 on the Financial Statements.
Assets not included in Note 37 but which would
generally not be used to secure funding include
assets backing insurance and investment contracts
(see ‘Balance sheet of insurance manufacturing’ on
page 173) and Hong Kong government certificates
of indebtedness which secure Hong Kong currency
notes in circulation, which are included on the face
of the consolidated balance sheet. Additionally,
properties with net book values of US$33m (2010:
US$31m) are considered encumbered.