HSBC 2011 Annual Report Download - page 54
Download and view the complete annual report
Please find page 54 of the 2011 HSBC annual report below. You can navigate through the pages in the report by either clicking on the pages listed below, or by using the keyword search tool below to find specific information within the annual report.-
 1
1 -
2
-
3
-
4
-
5
-
6
-
7
-
8
-
9
-
10
-
11
-
12
-
13
-
14
-
15
-
16
-
17
-
18
-
19
-
20
-
21
-
22
-
23
-
24
-
25
-
26
-
27
-
28
-
29
-
30
-
31
-
32
-
33
-
34
-
35
-
36
-
37
-
38
-
39
-
40
-
41
-
42
-
43
-
 44
44 -
 45
45 -
 46
46 -
 47
47 -
 48
48 -
 49
49 -
 50
50 -
 51
51 -
 52
52 -
 53
53 -
 54
54 -
 55
55 -
 56
56 -
 57
57 -
 58
58 -
 59
59 -
 60
60 -
 61
61 -
 62
62 -
 63
63 -
 64
64 -
65
-
66
-
67
-
68
-
69
-
70
-
71
-
72
-
73
-
74
-
75
-
76
-
77
-
78
-
79
-
80
-
81
-
82
-
83
-
84
-
85
-
86
-
87
-
88
-
89
-
90
-
91
-
92
-
93
-
94
-
95
-
96
-
97
-
98
-
99
-
100
-
101
-
102
-
103
-
104
-
105
-
106
-
107
-
108
-
109
-
110
-
111
-
112
-
113
-
114
-
115
-
116
-
117
-
118
-
119
-
120
-
121
-
122
-
123
-
124
-
125
-
126
-
127
-
128
-
129
-
130
-
131
-
132
-
133
-
134
-
135
-
136
-
137
-
138
-
139
-
140
-
141
-
142
-
143
-
144
-
145
-
146
-
147
-
148
-
149
-
150
-
151
-
152
-
153
-
154
-
155
-
156
-
157
-
158
-
159
-
160
-
161
-
162
-
163
-
164
-
165
-
166
-
167
-
168
-
169
-
170
-
171
-
172
-
173
-
174
-
175
-
176
-
177
-
178
-
179
-
180
-
181
-
182
-
183
-
184
-
185
-
186
-
187
-
188
-
189
-
190
-
191
-
192
-
193
-
194
-
195
-
196
-
197
-
198
-
199
-
200
-
201
-
202
-
203
-
204
-
205
-
206
-
207
-
208
-
209
-
210
-
211
-
212
-
213
-
214
-
215
-
216
-
217
-
218
-
219
-
220
-
221
-
222
-
223
-
224
-
225
-
226
-
227
-
228
-
229
-
230
-
231
-
232
-
233
-
234
-
235
-
236
-
237
-
238
-
239
-
240
-
241
-
242
-
243
-
244
-
245
-
246
-
247
-
248
-
249
-
250
-
251
-
252
-
253
-
254
-
255
-
256
-
257
-
258
-
259
-
260
-
261
-
262
-
263
-
264
-
265
-
266
-
267
-
268
-
269
-
270
-
271
-
272
-
273
-
274
-
275
-
276
-
277
-
278
-
279
-
280
-
281
-
282
-
283
-
284
-
285
-
286
-
287
-
288
-
289
-
290
-
291
-
292
-
293
-
294
-
295
-
296
-
297
-
298
-
299
-
300
-
301
-
302
-
303
-
304
-
305
-
306
-
307
-
308
-
309
-
310
-
311
-
312
-
313
-
314
-
315
-
316
-
317
-
318
-
319
-
320
-
321
-
322
-
323
-
324
-
325
-
326
-
327
-
328
-
329
-
330
-
331
-
332
-
333
-
334
-
335
-
336
-
337
-
338
-
339
-
340
-
341
-
342
-
343
-
344
-
345
-
346
-
347
-
348
-
349
-
350
-
351
-
352
-
353
-
354
-
355
-
356
-
357
-
358
-
359
-
360
-
361
-
362
-
363
-
364
-
365
-
366
-
367
-
368
-
369
-
370
-
371
-
372
-
373
-
374
-
375
-
376
-
377
-
378
-
379
-
380
-
381
-
382
-
383
-
384
-
385
-
386
-
387
-
388
-
389
-
390
-
391
-
392
-
393
-
394
-
395
-
396
-
397
-
398
-
399
-
400
-
401
-
402
-
403
-
404
-
405
-
406
-
407
-
408
-
409
-
410
-
411
-
412
-
413
-
414
-
415
-
416
-
417
-
418
-
419
-
420
-
421
-
422
-
423
-
424
-
425
-
426
-
427
-
428
-
429
-
430
-
431
-
432
-
433
-
434
-
435
-
436
-
437
-
438
-
439
-
440
 |
 |

HSBC HOLDINGS PLC
Report of the Directors: Operating and Financial Review (continued)
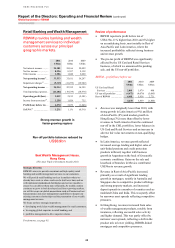
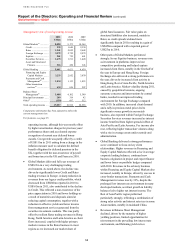
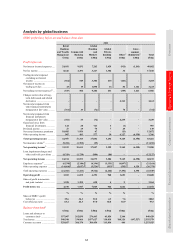
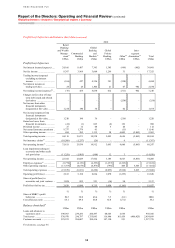
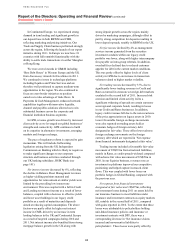
Global businesses > GB&M
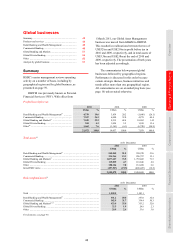
52
Management view of total operating income
2011
US$m
2010
US$m
2009
US$m
Global Markets57 .............. 8,098 9,173 10,364
Credit ........................... 335 1,649 2,330
Rates ............................ 1,341 2,052 2,648
Foreign Exchange ........ 3,272 2,752 2,979
Equities ........................ 961 755 641
Securities Services ....... 1,673 1,511 1,420
Asset and Structured
Finance ...................... 516 454 346
Global Banking ................ 5,401 4,621 4,630
Financing and Equity
Capital Markets ........ 3,233 2,852 3,070
Payments and Cash
Management58 ........... 1,534 1,133 1,053
Other transaction
services59 ................... 634 636 507
Balance Sheet
Management60 .............. 3,488 4,102 5,390
Principal Investments ...... 209 319 42
Other61 .............................. (139) 697 512
Total operating income .... 17,057 18,912 20,938
Comparative information has been adjusted to reflect the
current management view.
For footnotes, see page 95.
operating income, although this was mostly offset
by higher amortisation charges for previous years’
performance shares and accelerated expense
recognition of current year deferred bonus
awards. Cost growth was partly offset by a credit
of US$111m in 2011 arising from a change in the
inflation measure used to calculate the defined
benefit obligation for deferred pensions in the
UK, together with the non-recurrence of payroll
and bonus taxes in the UK and France in 2010.
• Global Markets delivered full year revenues of
US$8.1bn in a very challenging trading
environment. As noted above, the decline was
driven by significantly lower Credit and Rates
trading revenues in Europe. A sharp reduction in
revenues from our legacy credit portfolio, which
decreased from US$848m reported in 2010 to
US$165m in 2011, also contributed to the decline
in Credit. This reflected a non-recurrence of the
price appreciation in 2010 and lower holdings as
a result of maturities and disposals aimed at
reducing capital consumption, together with a
reduction in effective yields and lower income
from management services generated from the
securities investment conduits. This was partly
offset by resilient Rates trading revenues in Hong
Kong, North America and Latin America as client
flows increased, coupled with higher primary
market revenues in the Rates business in most
regions as we increased our market share of
global bond issuances. Fair value gains on
structured liabilities also increased, mainly in
Rates, as credit spreads widened more
significantly than in 2010, resulting in a gain of
US$458m compared with a reported gain of
US$23m in 2010.
• Other parts of Global Markets performed
strongly. In our Equities business, revenues rose
as investment in platforms improved our
competitive positioning and helped capture
increased client flows, notably in the first half of
the year in Europe and Hong Kong. Foreign
Exchange also delivered a strong performance in
the year, driven by increased client activity in
Hong Kong, Rest of Asia-Pacific, North America
and Latin America. Market volatility during 2011,
caused by geopolitical tensions, ongoing
eurozone concerns and interventions by central
banks, resulted in an improved trading
environment for Foreign Exchange compared
with 2010. In addition, increased client demand
and a rally in precious metal prices led to
significant revenue growth in our metals
business, also reported within Foreign Exchange.
Securities Services revenues increased as interest
income benefited from higher spreads in Rest of
Asia-Pacific and Latin America. Fee income also
rose, reflecting higher transaction volumes along
with a rise in average assets under custody and
administration.
• Global Banking delivered a strong performance
as we continued to focus on key client
relationships. Higher revenues in Financing and
Equity Capital Markets reflected a rise in average
corporate lending balances, continued new
business origination in project and export finance
and lower losses on portfolio hedges compared
with 2010. Revenues in the advisory business
within Financing and Equity Capital Markets also
increased, notably in Europe, driven by success in
cross-border transactions. Payments and Cash
Management revenue rose by 32%, despite the
prolonged low interest rate environment in many
developed markets, as robust growth in liability
balances led to higher net interest income. The
Rest of Asia-Pacific region performed
particularly strongly, reflecting a combination of
strong sales activity and interest rate rises in some
Asian markets, notably in mainland China.
• Revenues in Balance Sheet Management
declined, driven by the maturity of higher
yielding positions, limited opportunities for
reinvestment in the prevailing low interest rate
environment, and flattening yield curves.