HSBC 2011 Annual Report Download - page 358
Download and view the complete annual report
Please find page 358 of the 2011 HSBC annual report below. You can navigate through the pages in the report by either clicking on the pages listed below, or by using the keyword search tool below to find specific information within the annual report.-
 1
1 -
2
-
3
-
4
-
5
-
6
-
7
-
8
-
9
-
10
-
11
-
12
-
13
-
14
-
15
-
16
-
17
-
18
-
19
-
20
-
21
-
22
-
23
-
24
-
25
-
26
-
27
-
28
-
29
-
30
-
31
-
32
-
33
-
34
-
35
-
36
-
37
-
38
-
39
-
40
-
41
-
42
-
43
-
44
-
45
-
46
-
47
-
48
-
49
-
50
-
51
-
52
-
53
-
54
-
55
-
56
-
57
-
58
-
59
-
60
-
61
-
62
-
63
-
64
-
65
-
66
-
67
-
68
-
69
-
70
-
71
-
72
-
73
-
74
-
75
-
76
-
77
-
78
-
79
-
80
-
81
-
82
-
83
-
84
-
85
-
86
-
87
-
88
-
89
-
90
-
91
-
92
-
93
-
94
-
95
-
96
-
97
-
98
-
99
-
100
-
101
-
102
-
103
-
104
-
105
-
106
-
107
-
108
-
109
-
110
-
111
-
112
-
113
-
114
-
115
-
116
-
117
-
118
-
119
-
120
-
121
-
122
-
123
-
124
-
125
-
126
-
127
-
128
-
129
-
130
-
131
-
132
-
133
-
134
-
135
-
136
-
137
-
138
-
139
-
140
-
141
-
142
-
143
-
144
-
145
-
146
-
147
-
148
-
149
-
150
-
151
-
152
-
153
-
154
-
155
-
156
-
157
-
158
-
159
-
160
-
161
-
162
-
163
-
164
-
165
-
166
-
167
-
168
-
169
-
170
-
171
-
172
-
173
-
174
-
175
-
176
-
177
-
178
-
179
-
180
-
181
-
182
-
183
-
184
-
185
-
186
-
187
-
188
-
189
-
190
-
191
-
192
-
193
-
194
-
195
-
196
-
197
-
198
-
199
-
200
-
201
-
202
-
203
-
204
-
205
-
206
-
207
-
208
-
209
-
210
-
211
-
212
-
213
-
214
-
215
-
216
-
217
-
218
-
219
-
220
-
221
-
222
-
223
-
224
-
225
-
226
-
227
-
228
-
229
-
230
-
231
-
232
-
233
-
234
-
235
-
236
-
237
-
238
-
239
-
240
-
241
-
242
-
243
-
244
-
245
-
246
-
247
-
248
-
249
-
250
-
251
-
252
-
253
-
254
-
255
-
256
-
257
-
258
-
259
-
260
-
261
-
262
-
263
-
264
-
265
-
266
-
267
-
268
-
269
-
270
-
271
-
272
-
273
-
274
-
275
-
276
-
277
-
278
-
279
-
280
-
281
-
282
-
283
-
284
-
285
-
286
-
287
-
288
-
289
-
290
-
291
-
292
-
293
-
294
-
295
-
296
-
297
-
298
-
299
-
300
-
301
-
302
-
303
-
304
-
305
-
306
-
307
-
308
-
309
-
310
-
311
-
312
-
313
-
314
-
315
-
316
-
317
-
318
-
319
-
320
-
321
-
322
-
323
-
324
-
325
-
326
-
327
-
328
-
329
-
330
-
331
-
332
-
333
-
334
-
335
-
336
-
337
-
338
-
339
-
340
-
341
-
342
-
343
-
344
-
345
-
346
-
347
-
 348
348 -
 349
349 -
 350
350 -
 351
351 -
 352
352 -
 353
353 -
 354
354 -
 355
355 -
 356
356 -
 357
357 -
 358
358 -
 359
359 -
 360
360 -
 361
361 -
 362
362 -
 363
363 -
 364
364 -
 365
365 -
 366
366 -
 367
367 -
 368
368 -
369
-
370
-
371
-
372
-
373
-
374
-
375
-
376
-
377
-
378
-
379
-
380
-
381
-
382
-
383
-
384
-
385
-
386
-
387
-
388
-
389
-
390
-
391
-
392
-
393
-
394
-
395
-
396
-
397
-
398
-
399
-
400
-
401
-
402
-
403
-
404
-
405
-
406
-
407
-
408
-
409
-
410
-
411
-
412
-
413
-
414
-
415
-
416
-
417
-
418
-
419
-
420
-
421
-
422
-
423
-
424
-
425
-
426
-
427
-
428
-
429
-
430
-
431
-
432
-
433
-
434
-
435
-
436
-
437
-
438
-
439
-
440
 |
 |

HSBC HOLDINGS PLC
Notes on the Financial Statements (continued)
16 – Fair values of financial instruments carried at fair value / 17 – Fair values of financial instruments not carried at fair value
356
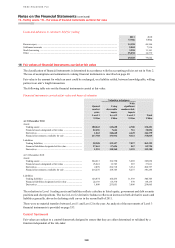
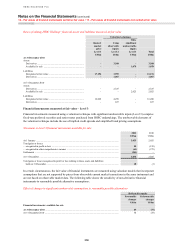
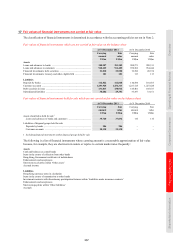
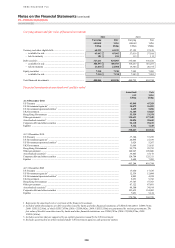
Bases of valuing HSBC Holdings’ financial assets and liabilities measured at fair value
Valuation techniques
Quoted
market
price
Using
observable
inputs
With
significant
unobservable
inputs
Level 1 Level 2 Level 3 Total
US$m US$m US$m US$m
At 31 December 2011
Assets
Derivatives ................................................................................ – 3,568 – 3,568
Available for sale ..................................................................... – – 1,078 1,078
Liabilities
Designated at fair value ............................................................ 17,196 3,955 – 21,151
Derivatives ................................................................................ – 1,067 – 1,067
At 31 December 2010
Assets
Derivatives ................................................................................ – 2,327 – 2,327
Available for sale ..................................................................... – – 2,025 2,025
Liabilities
Designated at fair value ............................................................ 12,029 4,259 – 16,288
Derivatives ................................................................................ – 827 – 827
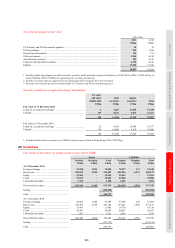
Financial instruments measured at fair value – Level 3
Financial investments measured using a valuation technique with significant unobservable inputs (Level 3) comprise
fixed-rate preferred securities and senior notes purchased from HSBC undertakings. The unobservable elements of
the valuation technique include the use of implied credit spreads and simplified bond pricing assumptions.
Movement in Level 3 financial instruments available for sale
2011 2010
US$m US$m
At 1 January .............................................................................................................................................. 2,025 2,455
Total gains or losses:
– recognised in profit or loss ................................................................................................................... 55 (155)
– recognised in other comprehensive income ......................................................................................... (61) (275)
Settlements ................................................................................................................................................ (941) –
At 31 December ........................................................................................................................................ 1,078 2,025
Total gains or losses recognised in profit or loss relating to those assets and liabilities
held on 31 December ............................................................................................................................ 18 (1)
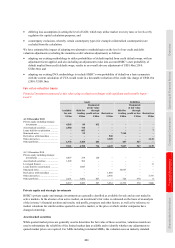
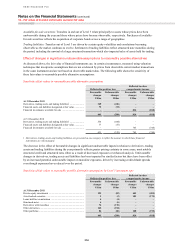
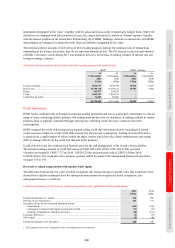
In certain circumstances, the fair value of financial instruments are measured using valuation models that incorporate
assumptions that are not supported by prices from observable current market transactions in the same instrument and
are not based on observable market data. The following table shows the sensitivity of non-derivative financial
instruments to reasonably possible alternative assumptions:
Effect of changes in significant unobservable assumptions to reasonably possible alternatives
Reflected in equity
Favourable
changes
Unfavourable
changes
US$m US$m
Financial investments: available for sale
At 31 December 2011 .............................................................................................................................. 69 (77)
At 31 December 2010 ............................................................................................................................... 34 (33)