HSBC 2011 Annual Report Download - page 84
Download and view the complete annual report
Please find page 84 of the 2011 HSBC annual report below. You can navigate through the pages in the report by either clicking on the pages listed below, or by using the keyword search tool below to find specific information within the annual report.-
 1
1 -
2
-
3
-
4
-
5
-
6
-
7
-
8
-
9
-
10
-
11
-
12
-
13
-
14
-
15
-
16
-
17
-
18
-
19
-
20
-
21
-
22
-
23
-
24
-
25
-
26
-
27
-
28
-
29
-
30
-
31
-
32
-
33
-
34
-
35
-
36
-
37
-
38
-
39
-
40
-
41
-
42
-
43
-
44
-
45
-
46
-
47
-
48
-
49
-
50
-
51
-
52
-
53
-
54
-
55
-
56
-
57
-
58
-
59
-
60
-
61
-
62
-
63
-
64
-
65
-
66
-
67
-
68
-
69
-
70
-
71
-
72
-
73
-
 74
74 -
 75
75 -
 76
76 -
 77
77 -
 78
78 -
 79
79 -
 80
80 -
 81
81 -
 82
82 -
 83
83 -
 84
84 -
 85
85 -
 86
86 -
 87
87 -
 88
88 -
 89
89 -
 90
90 -
 91
91 -
 92
92 -
 93
93 -
 94
94 -
95
-
96
-
97
-
98
-
99
-
100
-
101
-
102
-
103
-
104
-
105
-
106
-
107
-
108
-
109
-
110
-
111
-
112
-
113
-
114
-
115
-
116
-
117
-
118
-
119
-
120
-
121
-
122
-
123
-
124
-
125
-
126
-
127
-
128
-
129
-
130
-
131
-
132
-
133
-
134
-
135
-
136
-
137
-
138
-
139
-
140
-
141
-
142
-
143
-
144
-
145
-
146
-
147
-
148
-
149
-
150
-
151
-
152
-
153
-
154
-
155
-
156
-
157
-
158
-
159
-
160
-
161
-
162
-
163
-
164
-
165
-
166
-
167
-
168
-
169
-
170
-
171
-
172
-
173
-
174
-
175
-
176
-
177
-
178
-
179
-
180
-
181
-
182
-
183
-
184
-
185
-
186
-
187
-
188
-
189
-
190
-
191
-
192
-
193
-
194
-
195
-
196
-
197
-
198
-
199
-
200
-
201
-
202
-
203
-
204
-
205
-
206
-
207
-
208
-
209
-
210
-
211
-
212
-
213
-
214
-
215
-
216
-
217
-
218
-
219
-
220
-
221
-
222
-
223
-
224
-
225
-
226
-
227
-
228
-
229
-
230
-
231
-
232
-
233
-
234
-
235
-
236
-
237
-
238
-
239
-
240
-
241
-
242
-
243
-
244
-
245
-
246
-
247
-
248
-
249
-
250
-
251
-
252
-
253
-
254
-
255
-
256
-
257
-
258
-
259
-
260
-
261
-
262
-
263
-
264
-
265
-
266
-
267
-
268
-
269
-
270
-
271
-
272
-
273
-
274
-
275
-
276
-
277
-
278
-
279
-
280
-
281
-
282
-
283
-
284
-
285
-
286
-
287
-
288
-
289
-
290
-
291
-
292
-
293
-
294
-
295
-
296
-
297
-
298
-
299
-
300
-
301
-
302
-
303
-
304
-
305
-
306
-
307
-
308
-
309
-
310
-
311
-
312
-
313
-
314
-
315
-
316
-
317
-
318
-
319
-
320
-
321
-
322
-
323
-
324
-
325
-
326
-
327
-
328
-
329
-
330
-
331
-
332
-
333
-
334
-
335
-
336
-
337
-
338
-
339
-
340
-
341
-
342
-
343
-
344
-
345
-
346
-
347
-
348
-
349
-
350
-
351
-
352
-
353
-
354
-
355
-
356
-
357
-
358
-
359
-
360
-
361
-
362
-
363
-
364
-
365
-
366
-
367
-
368
-
369
-
370
-
371
-
372
-
373
-
374
-
375
-
376
-
377
-
378
-
379
-
380
-
381
-
382
-
383
-
384
-
385
-
386
-
387
-
388
-
389
-
390
-
391
-
392
-
393
-
394
-
395
-
396
-
397
-
398
-
399
-
400
-
401
-
402
-
403
-
404
-
405
-
406
-
407
-
408
-
409
-
410
-
411
-
412
-
413
-
414
-
415
-
416
-
417
-
418
-
419
-
420
-
421
-
422
-
423
-
424
-
425
-
426
-
427
-
428
-
429
-
430
-
431
-
432
-
433
-
434
-
435
-
436
-
437
-
438
-
439
-
440
 |
 |

HSBC HOLDINGS PLC
Report of the Directors: Operating and Financial Review (continued)
Geographical regions > North America
82
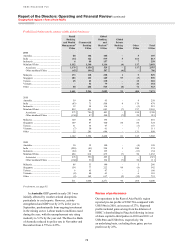
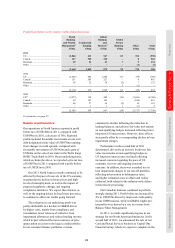
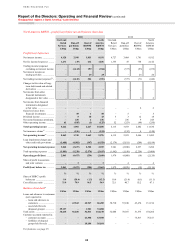
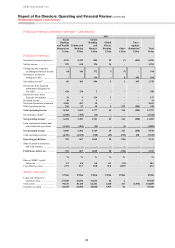
North America
Our North American businesses are located in
the US, Canada and Bermuda. Operations in
the US are primarily conducted through HSBC
Bank USA, N.A., and HSBC Finance, a national
consumer finance company. HSBC Markets
(USA) Inc. is the intermediate holding company
of, inter alia, HSBC Securities (USA) Inc.. HSBC
Bank Canada and HSBC Bank Bermuda operate
in their respective countries.
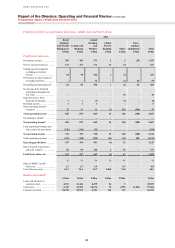
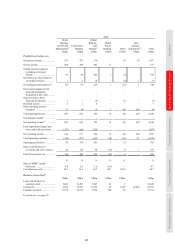
2011 2010 2009
US$m US$m US$m
Net interest income .......... 11,480 12,439 13,670
Net fee income ................. 3,308 3,664 4,817
Net trading income/
(expense) ....................... (362) 314 331
Other income/(expense) ... 1,574 630 (2,513)
Net operating income52 .. 16,000 17,047 16,305
Impairment charges53 ....... (7,016) (8,295) (15,664)
Net operating income .... 8,984 8,752 641
Total operating expenses . (8,919) (8,322) (8,391)
Operating profit/(loss) ... 65 430 (7,750)
Income from associates54 .. 35 24 12
Profit/(loss) before tax ... 100 454 (7,738)
Cost efficiency ratio ........ 55.7% 48.8% 51.5%
RoRWA55 ......................... –% 0.1% (2.1)%
Year-end staff numbers ... 30,981 33,865 35,458
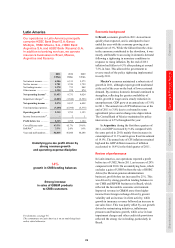
The sale of our Card and Retail Services
business and 195 non-strategic branches
announced
Gross balances in
run-off portfolio down by
US$8.9bn
to US$49.5bn
Reported pre-tax profit of
US$965m
from our Canadian operations
For footnotes, see page 95.
The commentary on North America is on an underlying basis
unless stated otherwise.
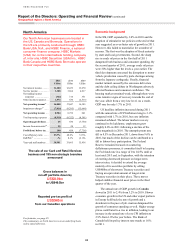
Economic background
In the US, GDP expanded by 3.0% in 2010 and the
adoption of stimulative tax policies at the end of that
year suggested an even faster rate of growth in 2011.
However, this failed to materialise for a number of
reasons. The first was the adoption of fiscal austerity
by state and local governments. Second, the sharp
rise in crude oil prices in the first half of 2011
dampened both business and consumer spending. By
the second quarter of 2011, average crude oil prices
were 50% higher than the levels a year earlier. The
third development concerned the disruption to motor
vehicle production caused by parts shortages arising
from the Japanese earthquake. Finally, financial
market turmoil caused by the eurozone debt crisis
and the debt ceiling debate in Washington adversely
affected business and consumer confidence. The
housing market remained weak, although there were
some tentative signs of recovery towards the end of
the year, albeit from a very low level. As a result,
GDP rose by only 1.7% in 2011.
US headline inflation increased during 2011
with the annual rate of CPI inflation rising to 3.1%
compared with 1.7% in 2010, but core inflation
remained subdued. The labour market recovery
continued to be lacklustre; employment grew
roughly 0.6% in 2011 following a decline of the
same magnitude in 2010. The unemployment rate
fell to 8.5% in December 2011, down from 9.6% in
2010, but much of the decline can be attributed to a
fall in labour force participation. The Federal
Reserve remained focused on countering
deflationary pressures; it committed itself to keeping
the Fed funds rate in a range of 0 to 0.25% until at
least mid-2013 and, in September, with the intention
of exerting downward pressure on longer-term
interest rates, it decided to extend the average
maturity of its securities portfolio by selling
US$400bn of short-term Treasury securities and
buying an equivalent amount of longer-term
Treasury securities in their place. These moves
helped stabilise financial asset prices in the final
quarter of the year.
The annual rate of GDP growth in Canada
slowed in 2011 to 2.4% from 3.2% in 2010. Slower
economic growth in the US and other export partners
in Europe held back the rate of growth and a
slowdown in the pace of job creation dampened the
growth of consumer spending as well. Higher energy
prices contributed to a rise in inflation, leading to an
increase in the annual rate of core CPI inflation to
2.9% from 1.8% the year before. The Bank of
Canada held its policy interest rate steady at 1.0%
in 2011.