HSBC 2011 Annual Report Download - page 75
Download and view the complete annual report
Please find page 75 of the 2011 HSBC annual report below. You can navigate through the pages in the report by either clicking on the pages listed below, or by using the keyword search tool below to find specific information within the annual report.-
 1
1 -
2
-
3
-
4
-
5
-
6
-
7
-
8
-
9
-
10
-
11
-
12
-
13
-
14
-
15
-
16
-
17
-
18
-
19
-
20
-
21
-
22
-
23
-
24
-
25
-
26
-
27
-
28
-
29
-
30
-
31
-
32
-
33
-
34
-
35
-
36
-
37
-
38
-
39
-
40
-
41
-
42
-
43
-
44
-
45
-
46
-
47
-
48
-
49
-
50
-
51
-
52
-
53
-
54
-
55
-
56
-
57
-
58
-
59
-
60
-
61
-
62
-
63
-
64
-
 65
65 -
 66
66 -
 67
67 -
 68
68 -
 69
69 -
 70
70 -
 71
71 -
 72
72 -
 73
73 -
 74
74 -
 75
75 -
 76
76 -
 77
77 -
 78
78 -
 79
79 -
 80
80 -
 81
81 -
 82
82 -
 83
83 -
 84
84 -
 85
85 -
86
-
87
-
88
-
89
-
90
-
91
-
92
-
93
-
94
-
95
-
96
-
97
-
98
-
99
-
100
-
101
-
102
-
103
-
104
-
105
-
106
-
107
-
108
-
109
-
110
-
111
-
112
-
113
-
114
-
115
-
116
-
117
-
118
-
119
-
120
-
121
-
122
-
123
-
124
-
125
-
126
-
127
-
128
-
129
-
130
-
131
-
132
-
133
-
134
-
135
-
136
-
137
-
138
-
139
-
140
-
141
-
142
-
143
-
144
-
145
-
146
-
147
-
148
-
149
-
150
-
151
-
152
-
153
-
154
-
155
-
156
-
157
-
158
-
159
-
160
-
161
-
162
-
163
-
164
-
165
-
166
-
167
-
168
-
169
-
170
-
171
-
172
-
173
-
174
-
175
-
176
-
177
-
178
-
179
-
180
-
181
-
182
-
183
-
184
-
185
-
186
-
187
-
188
-
189
-
190
-
191
-
192
-
193
-
194
-
195
-
196
-
197
-
198
-
199
-
200
-
201
-
202
-
203
-
204
-
205
-
206
-
207
-
208
-
209
-
210
-
211
-
212
-
213
-
214
-
215
-
216
-
217
-
218
-
219
-
220
-
221
-
222
-
223
-
224
-
225
-
226
-
227
-
228
-
229
-
230
-
231
-
232
-
233
-
234
-
235
-
236
-
237
-
238
-
239
-
240
-
241
-
242
-
243
-
244
-
245
-
246
-
247
-
248
-
249
-
250
-
251
-
252
-
253
-
254
-
255
-
256
-
257
-
258
-
259
-
260
-
261
-
262
-
263
-
264
-
265
-
266
-
267
-
268
-
269
-
270
-
271
-
272
-
273
-
274
-
275
-
276
-
277
-
278
-
279
-
280
-
281
-
282
-
283
-
284
-
285
-
286
-
287
-
288
-
289
-
290
-
291
-
292
-
293
-
294
-
295
-
296
-
297
-
298
-
299
-
300
-
301
-
302
-
303
-
304
-
305
-
306
-
307
-
308
-
309
-
310
-
311
-
312
-
313
-
314
-
315
-
316
-
317
-
318
-
319
-
320
-
321
-
322
-
323
-
324
-
325
-
326
-
327
-
328
-
329
-
330
-
331
-
332
-
333
-
334
-
335
-
336
-
337
-
338
-
339
-
340
-
341
-
342
-
343
-
344
-
345
-
346
-
347
-
348
-
349
-
350
-
351
-
352
-
353
-
354
-
355
-
356
-
357
-
358
-
359
-
360
-
361
-
362
-
363
-
364
-
365
-
366
-
367
-
368
-
369
-
370
-
371
-
372
-
373
-
374
-
375
-
376
-
377
-
378
-
379
-
380
-
381
-
382
-
383
-
384
-
385
-
386
-
387
-
388
-
389
-
390
-
391
-
392
-
393
-
394
-
395
-
396
-
397
-
398
-
399
-
400
-
401
-
402
-
403
-
404
-
405
-
406
-
407
-
408
-
409
-
410
-
411
-
412
-
413
-
414
-
415
-
416
-
417
-
418
-
419
-
420
-
421
-
422
-
423
-
424
-
425
-
426
-
427
-
428
-
429
-
430
-
431
-
432
-
433
-
434
-
435
-
436
-
437
-
438
-
439
-
440
 |
 |

73
Overview Operating & Financial Review Corporate Governance Financial Statements Shareholder Information
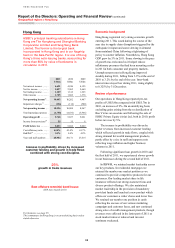
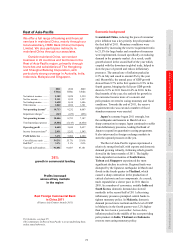
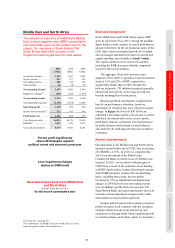
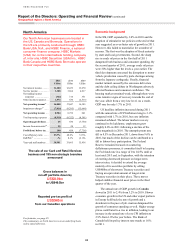
The growth in profitability in the region
reflected strong lending and deposit growth during
2010 and 2011, mainly in Singapore and mainland
China, coupled with widening deposit spreads due to
higher interest rates in certain countries, notably
India and mainland China. Loan impairment charges
improved as a result of the non-recurrence of a
number of individual impairments and the reduction
of certain unsecured lending portfolios. Costs
increased, though to a lesser extent than revenues, to
support business expansion, notably in mainland
China, and maintain our competitive position in our
six strategic markets. The contribution from our
associates in mainland China also grew, benefiting
from ongoing loan growth and increased income
from fee-based revenue streams.
We continued to invest in building our franchise
in mainland China where the operating profit of our
operations more than doubled and we remained
the leading foreign bank by network size. In CMB,
we increased the coverage of our renminbi trade
settlement services to 24 cities within the country,
representing the widest geographic coverage among
all foreign banks, and offered renminbi capabilities
in over 50 countries worldwide. Cross-border
referrals between mainland China and the rest of the
world grew by 9% compared with 2010 as we
capitalised on our international network to capture
outbound and inbound trade flows. In GB&M, we
focused on leveraging our global connectivity and
product capabilities to be the leading international
bank of choice for multinational corporations doing
business with mainland China and large corporates
looking to expand internationally.
Profit before tax increased in other key countries
across the region as we maintained our strategic
focus on these markets, particularly in
intermediating cross-border trade flows. Trade
revenues grew in most of our sites and we were
awarded the ‘Best Trade Finance Bank in Asia
Pacific’ by FinanceAsia for the fourteenth
consecutive year. Trade-related lending grew
strongly in Singapore as we continued to enhance
our trade finance capabilities. In Malaysia we
expanded our branch network through the launch of
new Amanah branches. We also experienced strong
commercial lending growth in both Malaysia and
Indonesia as a result of various marketing
campaigns. In India, we were ranked the number one
foreign bank by Bloomberg for domestic bonds in
2011 and issued the first and only offshore renminbi
bond in the country.
As part of our strategic review process, in
December 2011 we announced the sale of our private
banking operations in Japan and, in January 2012,
we announced the sale of our RBWM operations in
Thailand. We expect to complete these transactions
during 2012.
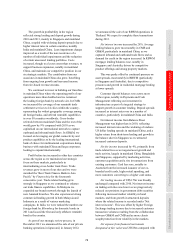
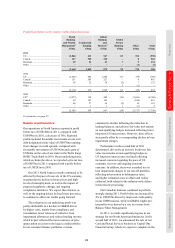
Net interest income increased by 28%. Average
lending balances grew most notably in CMB and
GB&M, particularly in mainland China, as we
captured inbound and outbound trade flows and as
demand for credit in the region increased. In RBWM
mortgage lending balances rose, notably in
Singapore and Australia, driven by competitive
product offerings and strong property markets.
This was partly offset by continued pressure on
asset spreads, most notably in RBWM (particularly
in Singapore and Australia), due to competitive
pressures and growth in residential mortgage lending
at lower spreads.
Customer deposit balances rose across most
of the region, notably in Payments and Cash
Management reflecting our investment in
infrastructure as part of a targeted strategy to
support growth in customer lending. Deposit spreads
increased as interest rates rose in a number of
countries, particularly in mainland China and India.
Net interest income from Balance Sheet
Management was higher than in 2010, reflecting
increased interest rates and the widening of onshore
US dollar lending spreads in mainland China, and a
higher return from short-term lending and growth in
the balance sheet in Singapore as we attracted
increased customer deposits.
Net fee income increased by 4%, primarily from
trade-related fees as we targeted asset growth and
trade activity, largely in mainland China, Bangladesh
and Singapore, supported by marketing activities,
customer acquisition and a rise in transactions from
existing customers. Card fees rose, notably in
Australia from the increased issuance of our co-
branded credit cards, higher retail spending, and
more customers converting to a higher card status.
Net trading income of US$1.7bn was broadly
unchanged compared with 2010. Net interest income
on trading activities was lower as we progressively
reduced our positions in government debt securities
following increased market volatility in bond
markets, and from growth in structured deposits
where the related income is recorded under ‘Net
interest income’. This was offset by higher Foreign
Exchange trading income due to increased customer
transaction volumes resulting from the collaboration
between GB&M and CMB and as more clients
sought protection from volatility in the markets.
Net expense from financial instruments
designated at fair value was US$18m compared with