HSBC 2011 Annual Report Download - page 67
Download and view the complete annual report
Please find page 67 of the 2011 HSBC annual report below. You can navigate through the pages in the report by either clicking on the pages listed below, or by using the keyword search tool below to find specific information within the annual report.-
 1
1 -
2
-
3
-
4
-
5
-
6
-
7
-
8
-
9
-
10
-
11
-
12
-
13
-
14
-
15
-
16
-
17
-
18
-
19
-
20
-
21
-
22
-
23
-
24
-
25
-
26
-
27
-
28
-
29
-
30
-
31
-
32
-
33
-
34
-
35
-
36
-
37
-
38
-
39
-
40
-
41
-
42
-
43
-
44
-
45
-
46
-
47
-
48
-
49
-
50
-
51
-
52
-
53
-
54
-
55
-
56
-
 57
57 -
 58
58 -
 59
59 -
 60
60 -
 61
61 -
 62
62 -
 63
63 -
 64
64 -
 65
65 -
 66
66 -
 67
67 -
 68
68 -
 69
69 -
 70
70 -
 71
71 -
 72
72 -
 73
73 -
 74
74 -
 75
75 -
 76
76 -
 77
77 -
78
-
79
-
80
-
81
-
82
-
83
-
84
-
85
-
86
-
87
-
88
-
89
-
90
-
91
-
92
-
93
-
94
-
95
-
96
-
97
-
98
-
99
-
100
-
101
-
102
-
103
-
104
-
105
-
106
-
107
-
108
-
109
-
110
-
111
-
112
-
113
-
114
-
115
-
116
-
117
-
118
-
119
-
120
-
121
-
122
-
123
-
124
-
125
-
126
-
127
-
128
-
129
-
130
-
131
-
132
-
133
-
134
-
135
-
136
-
137
-
138
-
139
-
140
-
141
-
142
-
143
-
144
-
145
-
146
-
147
-
148
-
149
-
150
-
151
-
152
-
153
-
154
-
155
-
156
-
157
-
158
-
159
-
160
-
161
-
162
-
163
-
164
-
165
-
166
-
167
-
168
-
169
-
170
-
171
-
172
-
173
-
174
-
175
-
176
-
177
-
178
-
179
-
180
-
181
-
182
-
183
-
184
-
185
-
186
-
187
-
188
-
189
-
190
-
191
-
192
-
193
-
194
-
195
-
196
-
197
-
198
-
199
-
200
-
201
-
202
-
203
-
204
-
205
-
206
-
207
-
208
-
209
-
210
-
211
-
212
-
213
-
214
-
215
-
216
-
217
-
218
-
219
-
220
-
221
-
222
-
223
-
224
-
225
-
226
-
227
-
228
-
229
-
230
-
231
-
232
-
233
-
234
-
235
-
236
-
237
-
238
-
239
-
240
-
241
-
242
-
243
-
244
-
245
-
246
-
247
-
248
-
249
-
250
-
251
-
252
-
253
-
254
-
255
-
256
-
257
-
258
-
259
-
260
-
261
-
262
-
263
-
264
-
265
-
266
-
267
-
268
-
269
-
270
-
271
-
272
-
273
-
274
-
275
-
276
-
277
-
278
-
279
-
280
-
281
-
282
-
283
-
284
-
285
-
286
-
287
-
288
-
289
-
290
-
291
-
292
-
293
-
294
-
295
-
296
-
297
-
298
-
299
-
300
-
301
-
302
-
303
-
304
-
305
-
306
-
307
-
308
-
309
-
310
-
311
-
312
-
313
-
314
-
315
-
316
-
317
-
318
-
319
-
320
-
321
-
322
-
323
-
324
-
325
-
326
-
327
-
328
-
329
-
330
-
331
-
332
-
333
-
334
-
335
-
336
-
337
-
338
-
339
-
340
-
341
-
342
-
343
-
344
-
345
-
346
-
347
-
348
-
349
-
350
-
351
-
352
-
353
-
354
-
355
-
356
-
357
-
358
-
359
-
360
-
361
-
362
-
363
-
364
-
365
-
366
-
367
-
368
-
369
-
370
-
371
-
372
-
373
-
374
-
375
-
376
-
377
-
378
-
379
-
380
-
381
-
382
-
383
-
384
-
385
-
386
-
387
-
388
-
389
-
390
-
391
-
392
-
393
-
394
-
395
-
396
-
397
-
398
-
399
-
400
-
401
-
402
-
403
-
404
-
405
-
406
-
407
-
408
-
409
-
410
-
411
-
412
-
413
-
414
-
415
-
416
-
417
-
418
-
419
-
420
-
421
-
422
-
423
-
424
-
425
-
426
-
427
-
428
-
429
-
430
-
431
-
432
-
433
-
434
-
435
-
436
-
437
-
438
-
439
-
440
 |
 |

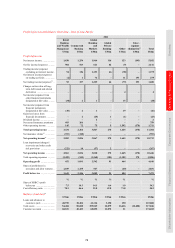
65
Overview Operating & Financial Review Corporate Governance Financial Statements Shareholder Information
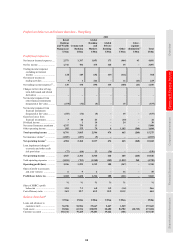
2010
Retail
Banking
and Wealth
Manage-
ment17
US$m
Commercial
Banking
US$m
Global
Banking
and
Markets17
US$m
Global
Private
Banking
US$m
Other
US$m
Inter-
segment
elimination64
US$m
Total
US$m
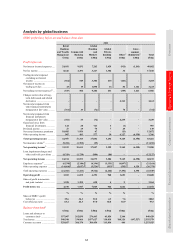
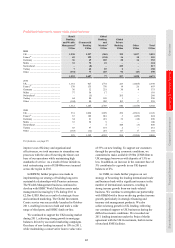
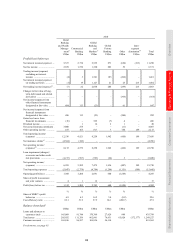
Profit/(loss) before tax
Net interest income/(expense) .... 5,537 2,774 2,935 871 (654) (213) 11,250
Net fee income ............................ 2,559 1,570 1,320 883 39 – 6,371
Trading income/(expense)
excluding net interest
income .................................... (6) 3 1,541 185 (262) – 1,461
Net interest income/(expense)
on trading activities ................ (1) 19 1,127 21 23 213 1,402
Net trading income/(expense)56 .. (7) 22 2,668 206 (239) 213 2,863
Changes in fair value of long-
term debt issued and related
derivatives .............................. – – – – (365) – (365)
Net income/(expense) from
other financial instruments
designated at fair value ........... 496 113 (23) – 61 – 647
Net income/(expense) from
financial instruments
designated at fair value ........... 496 113 (23) – (304) – 282
Gains less losses from
financial investments .............. (36) – 525 (7) 4 – 486
Dividend income ......................... – 1 16 2 1 – 20
Net earned insurance premiums . 3,800 278 – – (11) – 4,067
Other operating income .............. 187 163 817 7 754 189 2,117
Total operating income/
(expense) ................................ 12,536 4,921 8,258 1,962 (410) 189 27,456
Net insurance claims65 ................ (4,364) (342) – – – – (4,706)
Net operating income/
(expense)52 .............................. 8,172 4,579 8,258 1,962 (410) 189 22,750
Loan impairment (charges)/
recoveries and other credit
risk provisions ........................ (1,217) (997) (783) (26) 3 – (3,020)
Net operating income/
(expense) ................................ 6,955 3,582 7,475 1,936 (407) 189 19,730
Total operating expenses ............ (5,647) (2,378) (4,784) (1,296) (1,151) (189) (15,445)
Operating profit/(loss) ................ 1,308 1,204 2,691 640 (1,558) – 4,285
Share of profit in associates
and joint ventures ................... 4 1 12 – – – 17
Profit/(loss) before tax ................ 1,312 1,205 2,703 640 (1,558) – 4,302
% % % % % %
Share of HSBC’s profit
before tax ................................ 6.9 6.3 14.2 3.4 (8.2) 22.6
Cost efficiency ratio ................... 69.1 51.9 57.9 66.1 (280.7) 67.9
Balance sheet data49
US$m US$m US$m US$m US$m US$m
Loans and advances to
customers (net) ....................... 145,069 91,744 170,369 27,629 988 435,799
Total assets ................................. 205,032 111,356 962,861 76,631 65,824 (172,177) 1,249,527
Customer accounts ...................... 169,016 96,597 169,836 56,114 – 491,563
For footnotes, see page 95.