HSBC 2011 Annual Report Download - page 37
Download and view the complete annual report
Please find page 37 of the 2011 HSBC annual report below. You can navigate through the pages in the report by either clicking on the pages listed below, or by using the keyword search tool below to find specific information within the annual report.-
 1
1 -
2
-
3
-
4
-
5
-
6
-
7
-
8
-
9
-
10
-
11
-
12
-
13
-
14
-
15
-
16
-
17
-
18
-
19
-
20
-
21
-
22
-
23
-
24
-
25
-
26
-
 27
27 -
 28
28 -
 29
29 -
 30
30 -
 31
31 -
 32
32 -
 33
33 -
 34
34 -
 35
35 -
 36
36 -
 37
37 -
 38
38 -
 39
39 -
 40
40 -
 41
41 -
 42
42 -
 43
43 -
 44
44 -
 45
45 -
 46
46 -
 47
47 -
48
-
49
-
50
-
51
-
52
-
53
-
54
-
55
-
56
-
57
-
58
-
59
-
60
-
61
-
62
-
63
-
64
-
65
-
66
-
67
-
68
-
69
-
70
-
71
-
72
-
73
-
74
-
75
-
76
-
77
-
78
-
79
-
80
-
81
-
82
-
83
-
84
-
85
-
86
-
87
-
88
-
89
-
90
-
91
-
92
-
93
-
94
-
95
-
96
-
97
-
98
-
99
-
100
-
101
-
102
-
103
-
104
-
105
-
106
-
107
-
108
-
109
-
110
-
111
-
112
-
113
-
114
-
115
-
116
-
117
-
118
-
119
-
120
-
121
-
122
-
123
-
124
-
125
-
126
-
127
-
128
-
129
-
130
-
131
-
132
-
133
-
134
-
135
-
136
-
137
-
138
-
139
-
140
-
141
-
142
-
143
-
144
-
145
-
146
-
147
-
148
-
149
-
150
-
151
-
152
-
153
-
154
-
155
-
156
-
157
-
158
-
159
-
160
-
161
-
162
-
163
-
164
-
165
-
166
-
167
-
168
-
169
-
170
-
171
-
172
-
173
-
174
-
175
-
176
-
177
-
178
-
179
-
180
-
181
-
182
-
183
-
184
-
185
-
186
-
187
-
188
-
189
-
190
-
191
-
192
-
193
-
194
-
195
-
196
-
197
-
198
-
199
-
200
-
201
-
202
-
203
-
204
-
205
-
206
-
207
-
208
-
209
-
210
-
211
-
212
-
213
-
214
-
215
-
216
-
217
-
218
-
219
-
220
-
221
-
222
-
223
-
224
-
225
-
226
-
227
-
228
-
229
-
230
-
231
-
232
-
233
-
234
-
235
-
236
-
237
-
238
-
239
-
240
-
241
-
242
-
243
-
244
-
245
-
246
-
247
-
248
-
249
-
250
-
251
-
252
-
253
-
254
-
255
-
256
-
257
-
258
-
259
-
260
-
261
-
262
-
263
-
264
-
265
-
266
-
267
-
268
-
269
-
270
-
271
-
272
-
273
-
274
-
275
-
276
-
277
-
278
-
279
-
280
-
281
-
282
-
283
-
284
-
285
-
286
-
287
-
288
-
289
-
290
-
291
-
292
-
293
-
294
-
295
-
296
-
297
-
298
-
299
-
300
-
301
-
302
-
303
-
304
-
305
-
306
-
307
-
308
-
309
-
310
-
311
-
312
-
313
-
314
-
315
-
316
-
317
-
318
-
319
-
320
-
321
-
322
-
323
-
324
-
325
-
326
-
327
-
328
-
329
-
330
-
331
-
332
-
333
-
334
-
335
-
336
-
337
-
338
-
339
-
340
-
341
-
342
-
343
-
344
-
345
-
346
-
347
-
348
-
349
-
350
-
351
-
352
-
353
-
354
-
355
-
356
-
357
-
358
-
359
-
360
-
361
-
362
-
363
-
364
-
365
-
366
-
367
-
368
-
369
-
370
-
371
-
372
-
373
-
374
-
375
-
376
-
377
-
378
-
379
-
380
-
381
-
382
-
383
-
384
-
385
-
386
-
387
-
388
-
389
-
390
-
391
-
392
-
393
-
394
-
395
-
396
-
397
-
398
-
399
-
400
-
401
-
402
-
403
-
404
-
405
-
406
-
407
-
408
-
409
-
410
-
411
-
412
-
413
-
414
-
415
-
416
-
417
-
418
-
419
-
420
-
421
-
422
-
423
-
424
-
425
-
426
-
427
-
428
-
429
-
430
-
431
-
432
-
433
-
434
-
435
-
436
-
437
-
438
-
439
-
440
 |
 |

35
Overview Operating & Financial Review Corporate Governance Financial Statements Shareholder Information
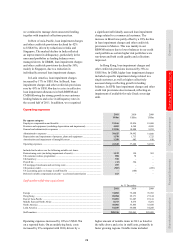
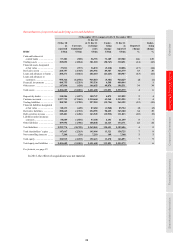
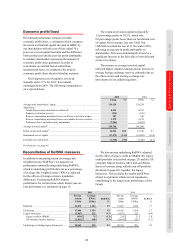
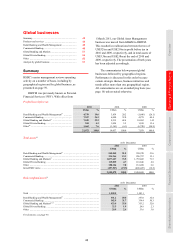
Reconciliation of reported and underlying assets and liabilities
31 December 2011 compared with 31 December 2010
31 Dec 10
as
reported
Currency
translation43
31 Dec 10
at 31 Dec 11
exchange
rates
Under-
lying
change
31 Dec 11
as
reported
Reported
change
Under-
lying
change
HSBC US$m US$m US$m US$m US$m % %
Cash and balances at
central banks ........................ 57,383 (590) 56,793 73,109 129,902 126 129
Trading assets .......................... 385,052 (3,834) 381,218 (50,767) 330,451 (14) (13)
Financial assets designated
at fair value .......................... 37,011 (937) 36,074 (5,218) 30,856 (17) (14)
Derivative assets ...................... 260,757 (3,765) 256,992 89,387 346,379 33 35
Loans and advances to banks .. 208,271 (5,661) 202,610 (21,623) 180,987 (13) (11)
Loans and advances to
customers ............................. 958,366 (12,556) 945,810 (5,381) 940,429 (2) (1)
Financial investments .............. 400,755 (5,219) 395,536 4,508 400,044 – 1
Other assets .............................. 147,094 (439) 146,655 49,876 196,531 34 34
Total assets .............................. 2,454,689 (33,001) 2,421,688 133,891 2,555,579 4 6
Deposits by banks .................... 110,584 (1,837) 108,747 4,075 112,822 2 4
Customer accounts ................... 1,227,725 (17,065) 1,210,660 43,265 1,253,925 2 4
Trading liabilities ..................... 300,703 (2,785) 297,918 (32,726) 265,192 (12) (11)
Financial liabilities designated
at fair value .......................... 88,133 (449) 87,684 (1,960) 85,724 (3) (2)
Derivative liabilities ................ 258,665 (3,710) 254,955 90,425 345,380 34 35
Debt securities in issue ............ 145,401 (1,456) 143,945 (12,932) 131,013 (10) (9)
Liabilities under insurance
contracts ............................... 58,609 (1,501) 57,108 4,151 61,259 5 7
Other liabilities ........................ 109,954 (1,906) 108,048 26,123 134,171 22 24
Total liabilities ......................... 2,299,774 (30,709) 2,269,065 120,421 2,389,486 4 5
Total shareholders’ equity ....... 147,667 (2,263) 145,404 13,321 158,725 7 9
Non-controlling interests ......... 7,248 (29) 7,219 149 7,368 2 2
Total equity .............................. 154,915 (2,292) 152,623 13,470 166,093 7 9
Total equity and liabilities ....... 2,454,689 (33,001) 2,421,688 133,891 2,555,579 4 6
For footnote, see page 95.
In 2011, the effect of acquisitions was not material.