HSBC 2011 Annual Report Download - page 368
Download and view the complete annual report
Please find page 368 of the 2011 HSBC annual report below. You can navigate through the pages in the report by either clicking on the pages listed below, or by using the keyword search tool below to find specific information within the annual report.-
 1
1 -
2
-
3
-
4
-
5
-
6
-
7
-
8
-
9
-
10
-
11
-
12
-
13
-
14
-
15
-
16
-
17
-
18
-
19
-
20
-
21
-
22
-
23
-
24
-
25
-
26
-
27
-
28
-
29
-
30
-
31
-
32
-
33
-
34
-
35
-
36
-
37
-
38
-
39
-
40
-
41
-
42
-
43
-
44
-
45
-
46
-
47
-
48
-
49
-
50
-
51
-
52
-
53
-
54
-
55
-
56
-
57
-
58
-
59
-
60
-
61
-
62
-
63
-
64
-
65
-
66
-
67
-
68
-
69
-
70
-
71
-
72
-
73
-
74
-
75
-
76
-
77
-
78
-
79
-
80
-
81
-
82
-
83
-
84
-
85
-
86
-
87
-
88
-
89
-
90
-
91
-
92
-
93
-
94
-
95
-
96
-
97
-
98
-
99
-
100
-
101
-
102
-
103
-
104
-
105
-
106
-
107
-
108
-
109
-
110
-
111
-
112
-
113
-
114
-
115
-
116
-
117
-
118
-
119
-
120
-
121
-
122
-
123
-
124
-
125
-
126
-
127
-
128
-
129
-
130
-
131
-
132
-
133
-
134
-
135
-
136
-
137
-
138
-
139
-
140
-
141
-
142
-
143
-
144
-
145
-
146
-
147
-
148
-
149
-
150
-
151
-
152
-
153
-
154
-
155
-
156
-
157
-
158
-
159
-
160
-
161
-
162
-
163
-
164
-
165
-
166
-
167
-
168
-
169
-
170
-
171
-
172
-
173
-
174
-
175
-
176
-
177
-
178
-
179
-
180
-
181
-
182
-
183
-
184
-
185
-
186
-
187
-
188
-
189
-
190
-
191
-
192
-
193
-
194
-
195
-
196
-
197
-
198
-
199
-
200
-
201
-
202
-
203
-
204
-
205
-
206
-
207
-
208
-
209
-
210
-
211
-
212
-
213
-
214
-
215
-
216
-
217
-
218
-
219
-
220
-
221
-
222
-
223
-
224
-
225
-
226
-
227
-
228
-
229
-
230
-
231
-
232
-
233
-
234
-
235
-
236
-
237
-
238
-
239
-
240
-
241
-
242
-
243
-
244
-
245
-
246
-
247
-
248
-
249
-
250
-
251
-
252
-
253
-
254
-
255
-
256
-
257
-
258
-
259
-
260
-
261
-
262
-
263
-
264
-
265
-
266
-
267
-
268
-
269
-
270
-
271
-
272
-
273
-
274
-
275
-
276
-
277
-
278
-
279
-
280
-
281
-
282
-
283
-
284
-
285
-
286
-
287
-
288
-
289
-
290
-
291
-
292
-
293
-
294
-
295
-
296
-
297
-
298
-
299
-
300
-
301
-
302
-
303
-
304
-
305
-
306
-
307
-
308
-
309
-
310
-
311
-
312
-
313
-
314
-
315
-
316
-
317
-
318
-
319
-
320
-
321
-
322
-
323
-
324
-
325
-
326
-
327
-
328
-
329
-
330
-
331
-
332
-
333
-
334
-
335
-
336
-
337
-
338
-
339
-
340
-
341
-
342
-
343
-
344
-
345
-
346
-
347
-
348
-
349
-
350
-
351
-
352
-
353
-
354
-
355
-
356
-
357
-
 358
358 -
 359
359 -
 360
360 -
 361
361 -
 362
362 -
 363
363 -
 364
364 -
 365
365 -
 366
366 -
 367
367 -
 368
368 -
 369
369 -
 370
370 -
 371
371 -
 372
372 -
 373
373 -
 374
374 -
 375
375 -
 376
376 -
 377
377 -
 378
378 -
379
-
380
-
381
-
382
-
383
-
384
-
385
-
386
-
387
-
388
-
389
-
390
-
391
-
392
-
393
-
394
-
395
-
396
-
397
-
398
-
399
-
400
-
401
-
402
-
403
-
404
-
405
-
406
-
407
-
408
-
409
-
410
-
411
-
412
-
413
-
414
-
415
-
416
-
417
-
418
-
419
-
420
-
421
-
422
-
423
-
424
-
425
-
426
-
427
-
428
-
429
-
430
-
431
-
432
-
433
-
434
-
435
-
436
-
437
-
438
-
439
-
440
 |
 |
HSBC HOLDINGS PLC
Notes on the Financial Statements (continued)
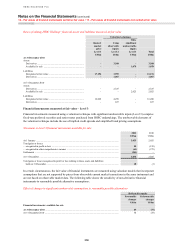
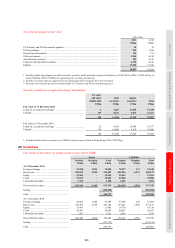
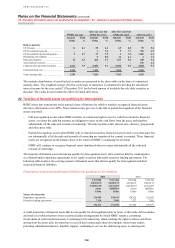
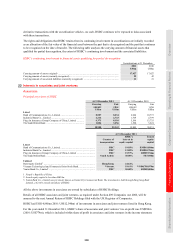
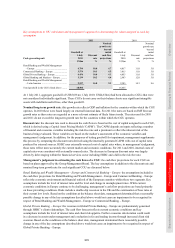
21 – Financial investments
366
Carrying amount and fair value of financial investments
2011 2010
Carrying
amount
Fair
value
Carrying
amount
Fair
value
US$m US$m US$m US$m
Treasury and other eligible bills ................................................... 65,223 65,223 57,129 57,129
– available for sale .................................................................. 65,042 65,042 57,016 57,016
– held to maturity .................................................................... 181 181 113 113
Debt securities .............................................................................. 327,611 329,093 335,643 336,632
– available for sale .................................................................. 306,593 306,593 316,257 316,257
– held to maturity .................................................................... 21,018 22,500 19,386 20,375
Equity securities ........................................................................... 7,210 7,210 7,983 7,983
– available for sale .................................................................. 7,210 7,210 7,983 7,983
Total financial investments ........................................................... 400,044 401,526 400,755 401,744
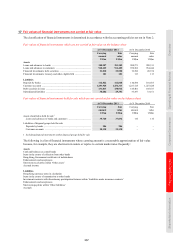
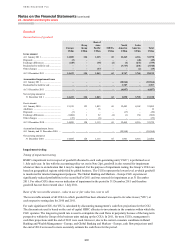
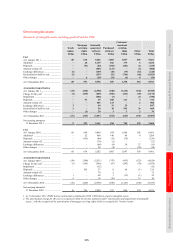
Financial investments at amortised cost1 and fair value2
Amortised
cost
Fair
value
US$m US$m
At 31 December 2011
US Treasury .............................................................................................................................................. 43,848 45,283
US Government agencies3 ........................................................................................................................ 25,079 26,093
US Government sponsored entities3 ......................................................................................................... 4,425 5,056
UK Government ........................................................................................................................................ 32,165 33,603
Hong Kong Government .......................................................................................................................... 33,359 33,374
Other government ..................................................................................................................................... 125,623 127,049
Asset-backed securities4 ........................................................................................................................... 35,096 28,625
Corporate debt and other securities .......................................................................................................... 94,110 95,233
Equities ..................................................................................................................................................... 5,122 7,210
398,827 401,526
At 31 December 2010
US Treasury .............................................................................................................................................. 37,380 37,255
US Government agencies3 ........................................................................................................................ 20,895 21,339
US Government sponsored entities3 ......................................................................................................... 5,029 5,267
UK Government ........................................................................................................................................ 31,069 31,815
Hong Kong Government .......................................................................................................................... 29,770 29,793
Other government ..................................................................................................................................... 108,947 109,806
Asset-backed securities4 ........................................................................................................................... 39,845 33,175
Corporate debt and other securities .......................................................................................................... 124,704 125,311
Equities ..................................................................................................................................................... 5,605 7,983
403,244 401,744
At 31 December 2009
US Treasury .............................................................................................................................................. 17,650 17,635
US Government agencies3 ........................................................................................................................ 12,539 12,804
US Government sponsored entities3 ......................................................................................................... 4,885 4,924
UK Government ........................................................................................................................................ 9,653 9,782
Hong Kong Government .......................................................................................................................... 37,747 37,763
Other government ..................................................................................................................................... 87,122 87,881
Asset-backed securities4 ........................................................................................................................... 48,500 34,914
Corporate debt and other securities .......................................................................................................... 153,639 154,902
Equities ..................................................................................................................................................... 7,051 9,124
378,786 369,729
1 Represents the amortised cost or cost basis of the financial investment.
2 Included within these figures are debt securities issued by banks and other financial institutions of US$68,334m (2010: US$99,733m;
2009: US$133,256m), of which US$17,079m (2010: US$38,862m; 2009: US$55,324m) are guaranteed by various governments. The
fair value of the debt securities issued by banks and other financial institutions was US$68,765m (2010: US$100,070m; 2009:
US$133,461m).
3 Includes securities that are supported by an explicit guarantee issued by the US Government.
4 Excludes asset-backed securities included under US Government agencies and sponsored entities.