HSBC 2011 Annual Report Download - page 400
Download and view the complete annual report
Please find page 400 of the 2011 HSBC annual report below. You can navigate through the pages in the report by either clicking on the pages listed below, or by using the keyword search tool below to find specific information within the annual report.-
 1
1 -
2
-
3
-
4
-
5
-
6
-
7
-
8
-
9
-
10
-
11
-
12
-
13
-
14
-
15
-
16
-
17
-
18
-
19
-
20
-
21
-
22
-
23
-
24
-
25
-
26
-
27
-
28
-
29
-
30
-
31
-
32
-
33
-
34
-
35
-
36
-
37
-
38
-
39
-
40
-
41
-
42
-
43
-
44
-
45
-
46
-
47
-
48
-
49
-
50
-
51
-
52
-
53
-
54
-
55
-
56
-
57
-
58
-
59
-
60
-
61
-
62
-
63
-
64
-
65
-
66
-
67
-
68
-
69
-
70
-
71
-
72
-
73
-
74
-
75
-
76
-
77
-
78
-
79
-
80
-
81
-
82
-
83
-
84
-
85
-
86
-
87
-
88
-
89
-
90
-
91
-
92
-
93
-
94
-
95
-
96
-
97
-
98
-
99
-
100
-
101
-
102
-
103
-
104
-
105
-
106
-
107
-
108
-
109
-
110
-
111
-
112
-
113
-
114
-
115
-
116
-
117
-
118
-
119
-
120
-
121
-
122
-
123
-
124
-
125
-
126
-
127
-
128
-
129
-
130
-
131
-
132
-
133
-
134
-
135
-
136
-
137
-
138
-
139
-
140
-
141
-
142
-
143
-
144
-
145
-
146
-
147
-
148
-
149
-
150
-
151
-
152
-
153
-
154
-
155
-
156
-
157
-
158
-
159
-
160
-
161
-
162
-
163
-
164
-
165
-
166
-
167
-
168
-
169
-
170
-
171
-
172
-
173
-
174
-
175
-
176
-
177
-
178
-
179
-
180
-
181
-
182
-
183
-
184
-
185
-
186
-
187
-
188
-
189
-
190
-
191
-
192
-
193
-
194
-
195
-
196
-
197
-
198
-
199
-
200
-
201
-
202
-
203
-
204
-
205
-
206
-
207
-
208
-
209
-
210
-
211
-
212
-
213
-
214
-
215
-
216
-
217
-
218
-
219
-
220
-
221
-
222
-
223
-
224
-
225
-
226
-
227
-
228
-
229
-
230
-
231
-
232
-
233
-
234
-
235
-
236
-
237
-
238
-
239
-
240
-
241
-
242
-
243
-
244
-
245
-
246
-
247
-
248
-
249
-
250
-
251
-
252
-
253
-
254
-
255
-
256
-
257
-
258
-
259
-
260
-
261
-
262
-
263
-
264
-
265
-
266
-
267
-
268
-
269
-
270
-
271
-
272
-
273
-
274
-
275
-
276
-
277
-
278
-
279
-
280
-
281
-
282
-
283
-
284
-
285
-
286
-
287
-
288
-
289
-
290
-
291
-
292
-
293
-
294
-
295
-
296
-
297
-
298
-
299
-
300
-
301
-
302
-
303
-
304
-
305
-
306
-
307
-
308
-
309
-
310
-
311
-
312
-
313
-
314
-
315
-
316
-
317
-
318
-
319
-
320
-
321
-
322
-
323
-
324
-
325
-
326
-
327
-
328
-
329
-
330
-
331
-
332
-
333
-
334
-
335
-
336
-
337
-
338
-
339
-
340
-
341
-
342
-
343
-
344
-
345
-
346
-
347
-
348
-
349
-
350
-
351
-
352
-
353
-
354
-
355
-
356
-
357
-
358
-
359
-
360
-
361
-
362
-
363
-
364
-
365
-
366
-
367
-
368
-
369
-
370
-
371
-
372
-
373
-
374
-
375
-
376
-
377
-
378
-
379
-
380
-
381
-
382
-
383
-
384
-
385
-
386
-
387
-
388
-
389
-
 390
390 -
 391
391 -
 392
392 -
 393
393 -
 394
394 -
 395
395 -
 396
396 -
 397
397 -
 398
398 -
 399
399 -
 400
400 -
 401
401 -
 402
402 -
 403
403 -
 404
404 -
 405
405 -
 406
406 -
 407
407 -
 408
408 -
 409
409 -
 410
410 -
411
-
412
-
413
-
414
-
415
-
416
-
417
-
418
-
419
-
420
-
421
-
422
-
423
-
424
-
425
-
426
-
427
-
428
-
429
-
430
-
431
-
432
-
433
-
434
-
435
-
436
-
437
-
438
-
439
-
440
 |
 |

HSBC HOLDINGS PLC
Notes on the Financial Statements (continued)
40 – Notes on the statement of cash flows / 41 – Contingent liabilities, contractual commitments and guarantees
398
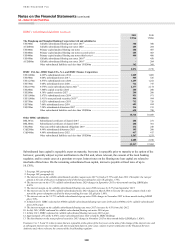
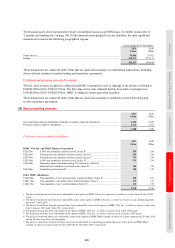
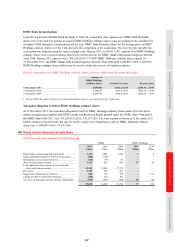
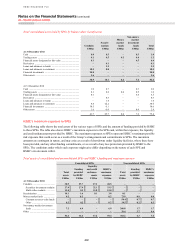
Change in operating assets
HSBC HSBC Holdings
2011 2010 2009 2011 2010
US$m US$m US$m US$m US$m
Change in loans to HSBC undertakings ........................... – – – (4,548) 1,974
Change in prepayments and accrued income ................... 1,907 457 3,198 96 (5)
Change in net trading securities and net derivatives ........ 27,058 60,337 15,388 (1,001) 1,119
Change in loans and advances to banks ........................... 2,618 5,213 (30,354) – –
Change in loans and advances to customers .................... (30,853) (79,283) 6,149 – –
Change in financial assets designated at fair value .......... (583) 154 (8,911) – –
Change in other assets ...................................................... (7,559) (145) (6,273) (36) 3
(7,412) (13,267) (20,803) (5,489) 3,091
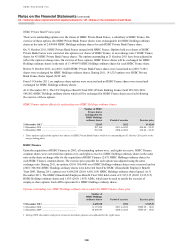
Change in operating liabilities
HSBC HSBC Holdings
2011 2010 2009 2011 2010
US$m US$m US$m US$m US$m
Change in accruals and deferred income .......................... (800) 716 (2,258) 258 147
Change in deposits by banks ............................................ 2,238 (14,288) (5,216) – –
Change in customer accounts ........................................... 48,401 68,691 41,983 – –
Change in debt securities in issue .................................... (14,388) (1,495) (32,797) (45) (171)
Change in financial liabilities designated at fair value .... 5,468 5,659 7,430 (475) (621)
Change in other liabilities ................................................. 3,093 (17,011) 5,503 (152) (1,109)
44,012 42,272 14,645 (414) (1,754)
Cash and cash equivalents
HSBC HSBC Holdings
2011 2010 2009 2011 2010
US$m US$m US$m US$m US$m
Cash at bank with HSBC undertakings ............................ – – – 316 459
Cash and balances at central banks .................................. 129,902 57,383 60,655 – –
Items in the course of collection from other banks .......... 8,208 6,072 6,395 – –
Loans and advances to banks of one month or less ......... 169,858 189,197 160,673 – –
Treasury bills, other bills and certificates of deposit
less than three months .................................................. 26,226 28,087 28,777 – –
Less: items in the course of transmission to
other banks ................................................................... (8,745) (6,663) (5,734) – –
325,449 274,076 250,766 316 459
Interest and dividends
HSBC HSBC Holdings
2011 2010 2009 2011 2010
US$m US$m US$m US$m US$m
Interest paid ...................................................................... (23,125) (21,405) (29,030) (2,392) (2,363)
Interest received ................................................................ 66,734 63,696 74,062 1,559 1,405
Dividends received ........................................................... 602 563 1,023 6,874 7,008
The amount of cash and cash equivalents not available for use by HSBC at 31 December 2011 was US$39,345m
(2010: US$37,413m), of which US$25,819m (2010: US$28,780m) related to mandatory deposits at central banks.