HSBC 2011 Annual Report Download - page 213
Download and view the complete annual report
Please find page 213 of the 2011 HSBC annual report below. You can navigate through the pages in the report by either clicking on the pages listed below, or by using the keyword search tool below to find specific information within the annual report.-
 1
1 -
2
-
3
-
4
-
5
-
6
-
7
-
8
-
9
-
10
-
11
-
12
-
13
-
14
-
15
-
16
-
17
-
18
-
19
-
20
-
21
-
22
-
23
-
24
-
25
-
26
-
27
-
28
-
29
-
30
-
31
-
32
-
33
-
34
-
35
-
36
-
37
-
38
-
39
-
40
-
41
-
42
-
43
-
44
-
45
-
46
-
47
-
48
-
49
-
50
-
51
-
52
-
53
-
54
-
55
-
56
-
57
-
58
-
59
-
60
-
61
-
62
-
63
-
64
-
65
-
66
-
67
-
68
-
69
-
70
-
71
-
72
-
73
-
74
-
75
-
76
-
77
-
78
-
79
-
80
-
81
-
82
-
83
-
84
-
85
-
86
-
87
-
88
-
89
-
90
-
91
-
92
-
93
-
94
-
95
-
96
-
97
-
98
-
99
-
100
-
101
-
102
-
103
-
104
-
105
-
106
-
107
-
108
-
109
-
110
-
111
-
112
-
113
-
114
-
115
-
116
-
117
-
118
-
119
-
120
-
121
-
122
-
123
-
124
-
125
-
126
-
127
-
128
-
129
-
130
-
131
-
132
-
133
-
134
-
135
-
136
-
137
-
138
-
139
-
140
-
141
-
142
-
143
-
144
-
145
-
146
-
147
-
148
-
149
-
150
-
151
-
152
-
153
-
154
-
155
-
156
-
157
-
158
-
159
-
160
-
161
-
162
-
163
-
164
-
165
-
166
-
167
-
168
-
169
-
170
-
171
-
172
-
173
-
174
-
175
-
176
-
177
-
178
-
179
-
180
-
181
-
182
-
183
-
184
-
185
-
186
-
187
-
188
-
189
-
190
-
191
-
192
-
193
-
194
-
195
-
196
-
197
-
198
-
199
-
200
-
201
-
202
-
 203
203 -
 204
204 -
 205
205 -
 206
206 -
 207
207 -
 208
208 -
 209
209 -
 210
210 -
 211
211 -
 212
212 -
 213
213 -
 214
214 -
 215
215 -
 216
216 -
 217
217 -
 218
218 -
 219
219 -
 220
220 -
 221
221 -
 222
222 -
 223
223 -
224
-
225
-
226
-
227
-
228
-
229
-
230
-
231
-
232
-
233
-
234
-
235
-
236
-
237
-
238
-
239
-
240
-
241
-
242
-
243
-
244
-
245
-
246
-
247
-
248
-
249
-
250
-
251
-
252
-
253
-
254
-
255
-
256
-
257
-
258
-
259
-
260
-
261
-
262
-
263
-
264
-
265
-
266
-
267
-
268
-
269
-
270
-
271
-
272
-
273
-
274
-
275
-
276
-
277
-
278
-
279
-
280
-
281
-
282
-
283
-
284
-
285
-
286
-
287
-
288
-
289
-
290
-
291
-
292
-
293
-
294
-
295
-
296
-
297
-
298
-
299
-
300
-
301
-
302
-
303
-
304
-
305
-
306
-
307
-
308
-
309
-
310
-
311
-
312
-
313
-
314
-
315
-
316
-
317
-
318
-
319
-
320
-
321
-
322
-
323
-
324
-
325
-
326
-
327
-
328
-
329
-
330
-
331
-
332
-
333
-
334
-
335
-
336
-
337
-
338
-
339
-
340
-
341
-
342
-
343
-
344
-
345
-
346
-
347
-
348
-
349
-
350
-
351
-
352
-
353
-
354
-
355
-
356
-
357
-
358
-
359
-
360
-
361
-
362
-
363
-
364
-
365
-
366
-
367
-
368
-
369
-
370
-
371
-
372
-
373
-
374
-
375
-
376
-
377
-
378
-
379
-
380
-
381
-
382
-
383
-
384
-
385
-
386
-
387
-
388
-
389
-
390
-
391
-
392
-
393
-
394
-
395
-
396
-
397
-
398
-
399
-
400
-
401
-
402
-
403
-
404
-
405
-
406
-
407
-
408
-
409
-
410
-
411
-
412
-
413
-
414
-
415
-
416
-
417
-
418
-
419
-
420
-
421
-
422
-
423
-
424
-
425
-
426
-
427
-
428
-
429
-
430
-
431
-
432
-
433
-
434
-
435
-
436
-
437
-
438
-
439
-
440
 |
 |

211
Overview Operating & Financial Review Corporate Governance Financial Statements Shareholder Information
Capital
Capital overview ................................................................ 211
Movement in risk-weighted assets in 2011 ....................... 211
Movement in tier 1 capital in 2011 ................................... 212
Future developments ......................................................... 212
Appendix to Capital ........................................................... 215
Our objective in the management of Group
capital is to maintain efficient levels of well
diversified and varied forms of capital to
support our business strategy and meet
our regulatory requirements.
Capital management
(Unaudited)
Our approach to capital management is driven by our strategic
and organisational requirements, taking into account the
regulatory, economic and commercial environment in which
we operate. It is our objective to maintain a strong capital base
to support the development of our business and to meet
regulatory capital requirements at all times. To achieve this,
our policy is to hold capital in a range of different forms and
from diverse sources.
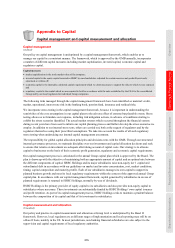
Capital measurement and allocation
(Unaudited)
The FSA supervises HSBC on a consolidated basis and
therefore receives information on the capital adequacy of, and
sets capital requirements for, the Group as a whole. Individual
banking subsidiaries are directly regulated by their local
banking supervisors, who set and monitor their capital
adequacy requirements. We calculate capital at a Group level
using the Basel II framework of the Basel Committee on
Banking Supervision as implemented by the FSA.
A summary of our policies and practices
regarding capital management, measurement
and allocation is provided in the Appendix to
Capital on page 215.
Capital overview
In 2011, there were no material changes to our
capital policies except to reflect the introduction
of the Capital Requirement Directive (‘CRD’) III
regulations in the EU, commonly known as
Basel 2.5, which increased the capital requirements
for market risk and re-securitisations, with effect
from 31 December 2011.
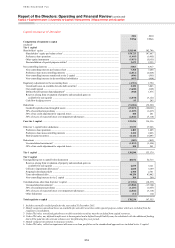
Capital ratios
(Unaudited)
2011 2010
% %
Core tier 1 ratio .......................... 10.1 10.5
Tier 1 ratio ................................. 11.5 12.1
Total capital ratio ....................... 14.1 15.2
Core tier 1 target range .............. 9.5 – 10.5
Eligibility requirements for non-equity
instruments under Basel III rules have not been
clearly defined in the UK. We therefore chose not to
issue any such capital securities during 2011.
Risk-weighted assets by risk type
(Unaudited)
2011 2010
US$m US$m
Credit risk ................................. 958,189 890,696
Counterparty credit risk ............ 53,792 50,175
Market risk ................................ 73,177 38,679
Operational risk ........................ 124,356 123,563
Total .......................................... 1,209,514 1,103,113
Movement in risk-weighted assets in 2011
(Unaudited)
RWAs increased by US$106bn or 10% in 2011.
Exchange rate differences caused a net reduction in
RWAs of around US$9bn in the year, reflecting the
strengthening of the US dollar against a range of
currencies, mainly in the faster-growing markets,
partly offset by the effect of the strengthening of
the renminbi against the US dollar. The remaining
increase in RWAs of US$115bn arose mainly in
credit risk and market risk.
RWAs increased by approximately US$50bn
as a result of the introduction of Basel 2.5, net of
mitigating actions undertaken by management. Of
this increase, around US$40bn was in market risk of
which the largest component was stressed VAR.
Higher risk weights on re-securitisations increased
credit risk RWAs by around US$10bn, primarily
impacting the GB&M legacy portfolios.
The increase in credit risk RWAs reflected
growth in our global businesses. In the Rest of Asia-
Pacific, trade finance and lending balances in our
CMB business grew as we captured inbound and
outbound trade flows and as demand for credit
increased. RWAs were also affected by increases in
loan balances in our mainland China associates. In
Latin America a favourable economic environment
drove growth in trade-related lending, increasing
RWAs in CMB and GB&M. In Europe, our CMB
business experienced growth in corporate lending in
the UK and Continental Europe.
In our RBWM business, the increase in
mortgage origination in Hong Kong and the UK had
only a marginal impact on RWAs, due to the low
risk weight applicable to the residential mortgages.
In our North America legacy retail business, we
continued to run-off the CML portfolio. This was
partially offset by the slow pace of recovery of the
US economy and deterioration in the US housing
market, resulting in increased average risk weights
applicable to those portfolios. Our strategy of
running down legacy RWAs continued in 2011 as