HSBC 2011 Annual Report Download - page 110
Download and view the complete annual report
Please find page 110 of the 2011 HSBC annual report below. You can navigate through the pages in the report by either clicking on the pages listed below, or by using the keyword search tool below to find specific information within the annual report.-
 1
1 -
2
-
3
-
4
-
5
-
6
-
7
-
8
-
9
-
10
-
11
-
12
-
13
-
14
-
15
-
16
-
17
-
18
-
19
-
20
-
21
-
22
-
23
-
24
-
25
-
26
-
27
-
28
-
29
-
30
-
31
-
32
-
33
-
34
-
35
-
36
-
37
-
38
-
39
-
40
-
41
-
42
-
43
-
44
-
45
-
46
-
47
-
48
-
49
-
50
-
51
-
52
-
53
-
54
-
55
-
56
-
57
-
58
-
59
-
60
-
61
-
62
-
63
-
64
-
65
-
66
-
67
-
68
-
69
-
70
-
71
-
72
-
73
-
74
-
75
-
76
-
77
-
78
-
79
-
80
-
81
-
82
-
83
-
84
-
85
-
86
-
87
-
88
-
89
-
90
-
91
-
92
-
93
-
94
-
95
-
96
-
97
-
98
-
99
-
 100
100 -
 101
101 -
 102
102 -
 103
103 -
 104
104 -
 105
105 -
 106
106 -
 107
107 -
 108
108 -
 109
109 -
 110
110 -
 111
111 -
 112
112 -
 113
113 -
 114
114 -
 115
115 -
 116
116 -
 117
117 -
 118
118 -
 119
119 -
 120
120 -
121
-
122
-
123
-
124
-
125
-
126
-
127
-
128
-
129
-
130
-
131
-
132
-
133
-
134
-
135
-
136
-
137
-
138
-
139
-
140
-
141
-
142
-
143
-
144
-
145
-
146
-
147
-
148
-
149
-
150
-
151
-
152
-
153
-
154
-
155
-
156
-
157
-
158
-
159
-
160
-
161
-
162
-
163
-
164
-
165
-
166
-
167
-
168
-
169
-
170
-
171
-
172
-
173
-
174
-
175
-
176
-
177
-
178
-
179
-
180
-
181
-
182
-
183
-
184
-
185
-
186
-
187
-
188
-
189
-
190
-
191
-
192
-
193
-
194
-
195
-
196
-
197
-
198
-
199
-
200
-
201
-
202
-
203
-
204
-
205
-
206
-
207
-
208
-
209
-
210
-
211
-
212
-
213
-
214
-
215
-
216
-
217
-
218
-
219
-
220
-
221
-
222
-
223
-
224
-
225
-
226
-
227
-
228
-
229
-
230
-
231
-
232
-
233
-
234
-
235
-
236
-
237
-
238
-
239
-
240
-
241
-
242
-
243
-
244
-
245
-
246
-
247
-
248
-
249
-
250
-
251
-
252
-
253
-
254
-
255
-
256
-
257
-
258
-
259
-
260
-
261
-
262
-
263
-
264
-
265
-
266
-
267
-
268
-
269
-
270
-
271
-
272
-
273
-
274
-
275
-
276
-
277
-
278
-
279
-
280
-
281
-
282
-
283
-
284
-
285
-
286
-
287
-
288
-
289
-
290
-
291
-
292
-
293
-
294
-
295
-
296
-
297
-
298
-
299
-
300
-
301
-
302
-
303
-
304
-
305
-
306
-
307
-
308
-
309
-
310
-
311
-
312
-
313
-
314
-
315
-
316
-
317
-
318
-
319
-
320
-
321
-
322
-
323
-
324
-
325
-
326
-
327
-
328
-
329
-
330
-
331
-
332
-
333
-
334
-
335
-
336
-
337
-
338
-
339
-
340
-
341
-
342
-
343
-
344
-
345
-
346
-
347
-
348
-
349
-
350
-
351
-
352
-
353
-
354
-
355
-
356
-
357
-
358
-
359
-
360
-
361
-
362
-
363
-
364
-
365
-
366
-
367
-
368
-
369
-
370
-
371
-
372
-
373
-
374
-
375
-
376
-
377
-
378
-
379
-
380
-
381
-
382
-
383
-
384
-
385
-
386
-
387
-
388
-
389
-
390
-
391
-
392
-
393
-
394
-
395
-
396
-
397
-
398
-
399
-
400
-
401
-
402
-
403
-
404
-
405
-
406
-
407
-
408
-
409
-
410
-
411
-
412
-
413
-
414
-
415
-
416
-
417
-
418
-
419
-
420
-
421
-
422
-
423
-
424
-
425
-
426
-
427
-
428
-
429
-
430
-
431
-
432
-
433
-
434
-
435
-
436
-
437
-
438
-
439
-
440
 |
 |
HSBC HOLDINGS PLC
Report of the Directors: Operating and Financial Review (continued)
Risk > Credit risk > Credit exposure
108
Concentration of exposure
Concentrations of credit risk are described in
the Appendix to Risk on page 188.
Securities held for trading
(Unaudited)
Total securities held for trading within trading
assets were US$186bn at 31 December 2011 (2010:
US$235bn). The largest concentration of these assets
was to government and government agency debt
securities. A detailed analysis of securities held for
trading is provided in Note 15 on the Financial
Statements and an analysis of credit quality on
page 127.
Debt securities, treasury and other eligible bills
(Unaudited)
Our holdings of corporate debt, ABSs and other
securities were spread across a wide range of issuers
and geographical regions, with 17% invested in
securities issued by banks and other financial
institutions. A detailed analysis of financial
investments is provided in Note 21 on the Financial
Statements and an analysis by credit quality on
page 127.
At 31 December 2011, our insurance businesses
held diversified portfolios of debt and equity
securities designated at fair value of US$28.9bn
(2010: US$28.3bn) and debt securities classified as
financial investments of US$40.1bn (2010:
US$38.5bn). For an analysis of securities held by the
insurance businesses, see page 178.
Derivatives
(Unaudited)
Derivative assets were US$346bn at 31 December
2011 (2010: US$261bn), of which the largest
concentrations were interest rate and foreign
exchange derivatives. For an analysis of derivatives,
see Note 20 on the Financial Statements.
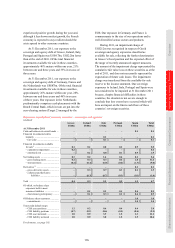
Loans and advances
(Unaudited)
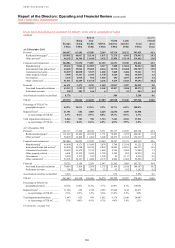
On a reported basis, gross loans and advances
to customers (excluding the financial sector) at
31 December 2011 were US$872bn, a decrease of
US$5.0bn or 1% from 31 December 2010.
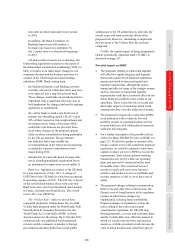
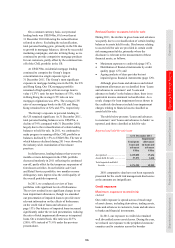
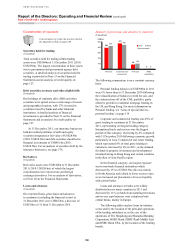
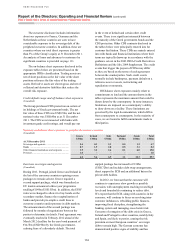
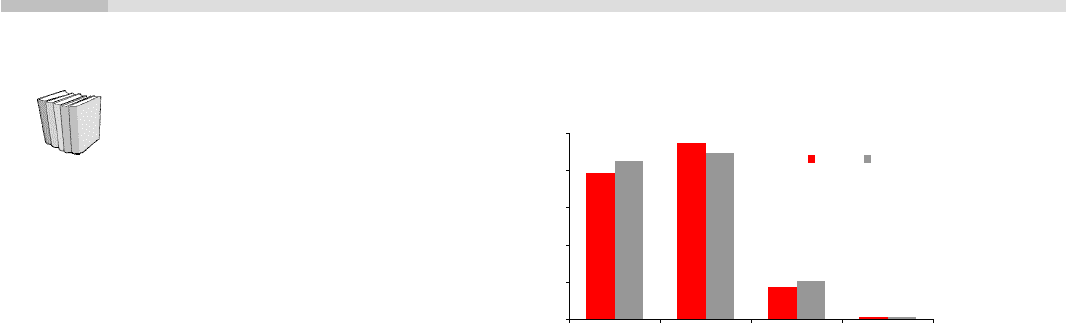
Summary of gross loans and advances to customers
(Unaudited)
425 446
102
6
5
86
473
394
0
100
200
300
400
500
Personal Corporate and
commercial
Financial ABSs
reclassified
2011 2010
(US$bn)
Reported basis
The following commentary is on a constant currency
basis:
Personal lending balances of US$394bn in 2011
were 6% lower than at 31 December 2010 following
the reclassification of balances to held for sale, and
the continued run-off of the CML portfolio, partly
offset by growth in residential mortgage lending in
the UK and Hong Kong. For more information on
Personal lending, see ‘Areas of special interest –
personal lending’ on page 119.
Corporate and commercial lending was 49% of
gross lending to customers at 31 December
2011, representing our largest lending category.
International trade and services was the biggest
portion of this category, increasing by 6% compared
with 31 December 2010 following economic growth,
particularly in Asia. Commercial real estate lending,
which represented 8% of total gross lending to
customers, increased by 4% in 2011, as the demand
for funds in property investment and development
remained strong in Hong Kong and certain countries
in the Rest of Asia-Pacific region.
In the financial category, our largest exposure
was to non-bank financial institutions which
decreased by 13% to US$85.3bn; this was mainly
in North America and related to lower reverse repos
as we increased our placements of excess liquidity
with central banks.
Loans and advances to banks were widely
distributed across many countries in 2011 and
decreased by 11% as funds from maturing term loans
and reverse repo balances were redeployed into
central banks, mainly in Europe.
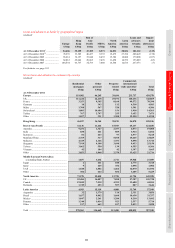
The following tables analyse loans by industry
sector and by the location of the principal operations
of the lending subsidiary or, in the case of the
operations of The Hongkong and Shanghai Banking
Corporation, HSBC Bank, HSBC Bank Middle East
and HSBC Bank USA, by the location of the lending
branch.