HSBC 2011 Annual Report Download - page 169
Download and view the complete annual report
Please find page 169 of the 2011 HSBC annual report below. You can navigate through the pages in the report by either clicking on the pages listed below, or by using the keyword search tool below to find specific information within the annual report.-
 1
1 -
2
-
3
-
4
-
5
-
6
-
7
-
8
-
9
-
10
-
11
-
12
-
13
-
14
-
15
-
16
-
17
-
18
-
19
-
20
-
21
-
22
-
23
-
24
-
25
-
26
-
27
-
28
-
29
-
30
-
31
-
32
-
33
-
34
-
35
-
36
-
37
-
38
-
39
-
40
-
41
-
42
-
43
-
44
-
45
-
46
-
47
-
48
-
49
-
50
-
51
-
52
-
53
-
54
-
55
-
56
-
57
-
58
-
59
-
60
-
61
-
62
-
63
-
64
-
65
-
66
-
67
-
68
-
69
-
70
-
71
-
72
-
73
-
74
-
75
-
76
-
77
-
78
-
79
-
80
-
81
-
82
-
83
-
84
-
85
-
86
-
87
-
88
-
89
-
90
-
91
-
92
-
93
-
94
-
95
-
96
-
97
-
98
-
99
-
100
-
101
-
102
-
103
-
104
-
105
-
106
-
107
-
108
-
109
-
110
-
111
-
112
-
113
-
114
-
115
-
116
-
117
-
118
-
119
-
120
-
121
-
122
-
123
-
124
-
125
-
126
-
127
-
128
-
129
-
130
-
131
-
132
-
133
-
134
-
135
-
136
-
137
-
138
-
139
-
140
-
141
-
142
-
143
-
144
-
145
-
146
-
147
-
148
-
149
-
150
-
151
-
152
-
153
-
154
-
155
-
156
-
157
-
158
-
 159
159 -
 160
160 -
 161
161 -
 162
162 -
 163
163 -
 164
164 -
 165
165 -
 166
166 -
 167
167 -
 168
168 -
 169
169 -
 170
170 -
 171
171 -
 172
172 -
 173
173 -
 174
174 -
 175
175 -
 176
176 -
 177
177 -
 178
178 -
 179
179 -
180
-
181
-
182
-
183
-
184
-
185
-
186
-
187
-
188
-
189
-
190
-
191
-
192
-
193
-
194
-
195
-
196
-
197
-
198
-
199
-
200
-
201
-
202
-
203
-
204
-
205
-
206
-
207
-
208
-
209
-
210
-
211
-
212
-
213
-
214
-
215
-
216
-
217
-
218
-
219
-
220
-
221
-
222
-
223
-
224
-
225
-
226
-
227
-
228
-
229
-
230
-
231
-
232
-
233
-
234
-
235
-
236
-
237
-
238
-
239
-
240
-
241
-
242
-
243
-
244
-
245
-
246
-
247
-
248
-
249
-
250
-
251
-
252
-
253
-
254
-
255
-
256
-
257
-
258
-
259
-
260
-
261
-
262
-
263
-
264
-
265
-
266
-
267
-
268
-
269
-
270
-
271
-
272
-
273
-
274
-
275
-
276
-
277
-
278
-
279
-
280
-
281
-
282
-
283
-
284
-
285
-
286
-
287
-
288
-
289
-
290
-
291
-
292
-
293
-
294
-
295
-
296
-
297
-
298
-
299
-
300
-
301
-
302
-
303
-
304
-
305
-
306
-
307
-
308
-
309
-
310
-
311
-
312
-
313
-
314
-
315
-
316
-
317
-
318
-
319
-
320
-
321
-
322
-
323
-
324
-
325
-
326
-
327
-
328
-
329
-
330
-
331
-
332
-
333
-
334
-
335
-
336
-
337
-
338
-
339
-
340
-
341
-
342
-
343
-
344
-
345
-
346
-
347
-
348
-
349
-
350
-
351
-
352
-
353
-
354
-
355
-
356
-
357
-
358
-
359
-
360
-
361
-
362
-
363
-
364
-
365
-
366
-
367
-
368
-
369
-
370
-
371
-
372
-
373
-
374
-
375
-
376
-
377
-
378
-
379
-
380
-
381
-
382
-
383
-
384
-
385
-
386
-
387
-
388
-
389
-
390
-
391
-
392
-
393
-
394
-
395
-
396
-
397
-
398
-
399
-
400
-
401
-
402
-
403
-
404
-
405
-
406
-
407
-
408
-
409
-
410
-
411
-
412
-
413
-
414
-
415
-
416
-
417
-
418
-
419
-
420
-
421
-
422
-
423
-
424
-
425
-
426
-
427
-
428
-
429
-
430
-
431
-
432
-
433
-
434
-
435
-
436
-
437
-
438
-
439
-
440
 |
 |

167
Overview Operating & Financial Review Corporate Governance Financial Statements Shareholder Information
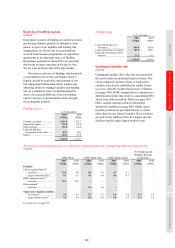
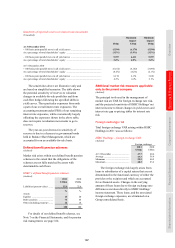
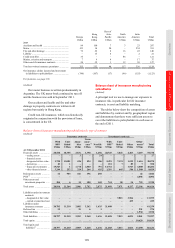
Sensitivity of reported reserves to interest rate movements
(Unaudited)
US$m
Maximum
impact
US$m
Minimum
impact
US$m
At 31 December 2011
+ 100 basis point parallel move in all yield curves .................................................... (5,594) (6,178) (5,594)
As a percentage of total shareholders’ equity ............................................................ (3.5%) (3.9%) (3.5%)
– 100 basis point parallel move in all yield curves .................................................... 5,397 6,411 5,397
As a percentage of total shareholders’ equity ............................................................ 3.4% 4.0% 3.4%
At 31 December 2010
+ 100 basis point parallel move in all yield curves .................................................... (6,162) (6,162) (3,096)
As a percentage of total shareholders’ equity ............................................................ (4.2%) (4.2%) (2.1%)
– 100 basis point parallel move in all yield curves .................................................... 6,174 6,174 3,108
As a percentage of total shareholders’ equity ............................................................ 4.2% 4.2% 2.1%
The sensitivities above are illustrative only and
are based on simplified scenarios. The table shows
the potential sensitivity of reserves to valuation
changes in available-for-sale portfolios and from
cash flow hedges following the specified shifts in
yield curves. These particular exposures form only
a part of our overall interest rate exposures. The
accounting treatment under IFRSs of our remaining
interest rate exposures, while economically largely
offsetting the exposures shown in the above table,
does not require revaluation movements to go to
reserves.
The year-on-year decrease in sensitivity of
reserves is due to a decrease in government bonds
held in Balance Sheet Management, which are
accounted for on an available-for-sale basis.
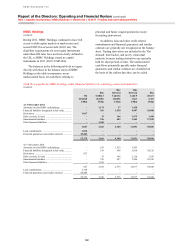
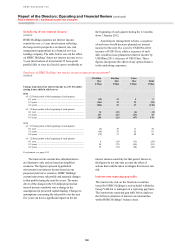
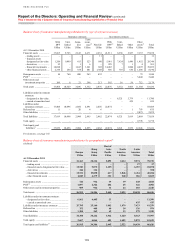
Defined benefit pension schemes
(Audited)
Market risk arises within our defined benefit pension
schemes to the extent that the obligations of the
schemes are not fully matched by assets with
determinable cash flows.
HSBC’s defined benefit pension schemes
(Audited)
2011 2010
US$bn US$bn
Liabilities (present value) ........ 35.0 32.6
% %
Assets:
Equities .................................... 15 20
Debt securities ......................... 73 66
Other (including property) ....... 12 14
100 100
For details of our defined benefit schemes, see
Note 7 on the Financial Statements, and for pension
risk management, see page 184.
Additional market risk measures applicable
only to the parent company
(Audited)
The principal tools used in the management of
market risk are VAR for foreign exchange rate risk,
and the projected sensitivity of HSBC Holdings’ net
interest income to future changes in yield curves and
interest rate gap re-pricing tables for interest rate
risk.
Foreign exchange risk
Total foreign exchange VAR arising within HSBC
Holdings in 2011 was as follows:
HSBC Holdings – foreign exchange VAR
(Audited)
Foreign exchange
2011
US$m
2010
US$m
At 31 December .............................. 47.7
40.4
Average ........................................... 43.3
56.6
Minimum ........................................ 38.2
40.2
Maximum ........................................ 48.3
83.2
The foreign exchange risk largely arises from
loans to subsidiaries of a capital nature that are not
denominated in the functional currency of either the
provider or the recipient and which are accounted
for as financial assets. Changes in the carrying
amount of these loans due to foreign exchange rate
differences are taken directly to HSBC Holdings’
income statement. These loans, and the associated
foreign exchange exposures, are eliminated on a
Group consolidated basis.