HSBC 2011 Annual Report Download - page 315
Download and view the complete annual report
Please find page 315 of the 2011 HSBC annual report below. You can navigate through the pages in the report by either clicking on the pages listed below, or by using the keyword search tool below to find specific information within the annual report.-
 1
1 -
2
-
3
-
4
-
5
-
6
-
7
-
8
-
9
-
10
-
11
-
12
-
13
-
14
-
15
-
16
-
17
-
18
-
19
-
20
-
21
-
22
-
23
-
24
-
25
-
26
-
27
-
28
-
29
-
30
-
31
-
32
-
33
-
34
-
35
-
36
-
37
-
38
-
39
-
40
-
41
-
42
-
43
-
44
-
45
-
46
-
47
-
48
-
49
-
50
-
51
-
52
-
53
-
54
-
55
-
56
-
57
-
58
-
59
-
60
-
61
-
62
-
63
-
64
-
65
-
66
-
67
-
68
-
69
-
70
-
71
-
72
-
73
-
74
-
75
-
76
-
77
-
78
-
79
-
80
-
81
-
82
-
83
-
84
-
85
-
86
-
87
-
88
-
89
-
90
-
91
-
92
-
93
-
94
-
95
-
96
-
97
-
98
-
99
-
100
-
101
-
102
-
103
-
104
-
105
-
106
-
107
-
108
-
109
-
110
-
111
-
112
-
113
-
114
-
115
-
116
-
117
-
118
-
119
-
120
-
121
-
122
-
123
-
124
-
125
-
126
-
127
-
128
-
129
-
130
-
131
-
132
-
133
-
134
-
135
-
136
-
137
-
138
-
139
-
140
-
141
-
142
-
143
-
144
-
145
-
146
-
147
-
148
-
149
-
150
-
151
-
152
-
153
-
154
-
155
-
156
-
157
-
158
-
159
-
160
-
161
-
162
-
163
-
164
-
165
-
166
-
167
-
168
-
169
-
170
-
171
-
172
-
173
-
174
-
175
-
176
-
177
-
178
-
179
-
180
-
181
-
182
-
183
-
184
-
185
-
186
-
187
-
188
-
189
-
190
-
191
-
192
-
193
-
194
-
195
-
196
-
197
-
198
-
199
-
200
-
201
-
202
-
203
-
204
-
205
-
206
-
207
-
208
-
209
-
210
-
211
-
212
-
213
-
214
-
215
-
216
-
217
-
218
-
219
-
220
-
221
-
222
-
223
-
224
-
225
-
226
-
227
-
228
-
229
-
230
-
231
-
232
-
233
-
234
-
235
-
236
-
237
-
238
-
239
-
240
-
241
-
242
-
243
-
244
-
245
-
246
-
247
-
248
-
249
-
250
-
251
-
252
-
253
-
254
-
255
-
256
-
257
-
258
-
259
-
260
-
261
-
262
-
263
-
264
-
265
-
266
-
267
-
268
-
269
-
270
-
271
-
272
-
273
-
274
-
275
-
276
-
277
-
278
-
279
-
280
-
281
-
282
-
283
-
284
-
285
-
286
-
287
-
288
-
289
-
290
-
291
-
292
-
293
-
294
-
295
-
296
-
297
-
298
-
299
-
300
-
301
-
302
-
303
-
304
-
 305
305 -
 306
306 -
 307
307 -
 308
308 -
 309
309 -
 310
310 -
 311
311 -
 312
312 -
 313
313 -
 314
314 -
 315
315 -
 316
316 -
 317
317 -
 318
318 -
 319
319 -
 320
320 -
 321
321 -
 322
322 -
 323
323 -
 324
324 -
 325
325 -
326
-
327
-
328
-
329
-
330
-
331
-
332
-
333
-
334
-
335
-
336
-
337
-
338
-
339
-
340
-
341
-
342
-
343
-
344
-
345
-
346
-
347
-
348
-
349
-
350
-
351
-
352
-
353
-
354
-
355
-
356
-
357
-
358
-
359
-
360
-
361
-
362
-
363
-
364
-
365
-
366
-
367
-
368
-
369
-
370
-
371
-
372
-
373
-
374
-
375
-
376
-
377
-
378
-
379
-
380
-
381
-
382
-
383
-
384
-
385
-
386
-
387
-
388
-
389
-
390
-
391
-
392
-
393
-
394
-
395
-
396
-
397
-
398
-
399
-
400
-
401
-
402
-
403
-
404
-
405
-
406
-
407
-
408
-
409
-
410
-
411
-
412
-
413
-
414
-
415
-
416
-
417
-
418
-
419
-
420
-
421
-
422
-
423
-
424
-
425
-
426
-
427
-
428
-
429
-
430
-
431
-
432
-
433
-
434
-
435
-
436
-
437
-
438
-
439
-
440
 |
 |
313
Overview Operating & Financial Review Corporate Governance Financial Statements Shareholder Information
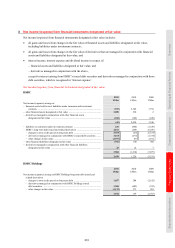
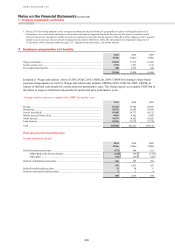
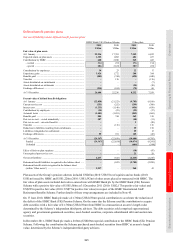
3 Net income/(expense) from financial instruments designated at fair value
Net income/(expense) from financial instruments designated at fair value includes:
• all gains and losses from changes in the fair value of financial assets and liabilities designated at fair value,
including liabilities under investment contracts;
• all gains and losses from changes in the fair value of derivatives that are managed in conjunction with financial
assets and liabilities designated at fair value; and
• interest income, interest expense and dividend income in respect of:
– financial assets and liabilities designated at fair value; and
– derivatives managed in conjunction with the above,
except for interest arising from HSBC’s issued debt securities and derivatives managed in conjunction with those
debt securities, which is recognised in ‘Interest expense’.
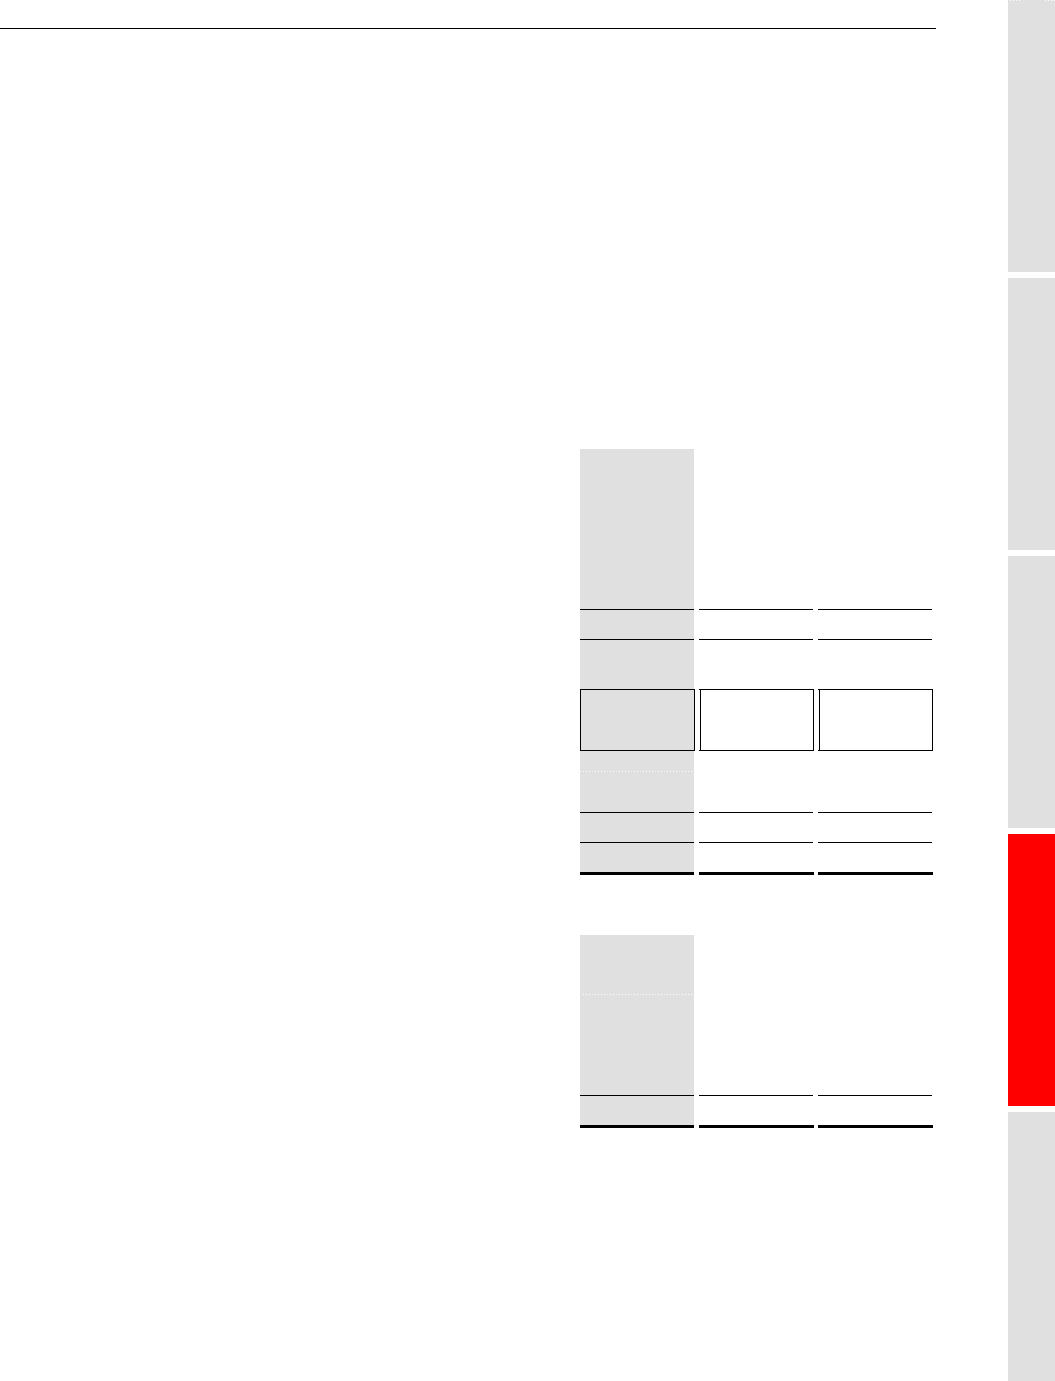
Net income/(expense) from financial instruments designated at fair value
HSBC
2011 2010 2009
US$m US$m US$m
Net income/(expense) arising on:
– financial assets held to meet liabilities under insurance and investment
contracts ............................................................................................................. (933) 2,349 3,793
– other financial assets designated at fair value ........................................................ 1,050 230 2
– derivatives managed in conjunction with other financial assets
designated at fair value ...................................................................................... (182) (149) (249)
(65) 2,430 3,546
– liabilities to customers under investment contracts ............................................... 231 (946) (1,329)
– HSBC’s long-term debt issued and related derivatives ......................................... 4,161 (258) (6,247)
– changes in own credit spread on long-term debt ............................................... 3,933 (63) (6,533)
– derivatives managed in conjunction with HSBC’s issued debt securities ........ 3,165 (275) (1,726)
– other changes in fair value ................................................................................. (2,937) 80 2,012
– other financial liabilities designated at fair value .................................................. (911) (18) 492
– derivatives managed in conjunction with other financial liabilities
designated at fair value ...................................................................................... 23 12 7
3,504 (1,210) (7,077)
3,439 1,220 (3,531)
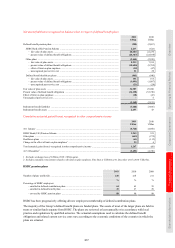
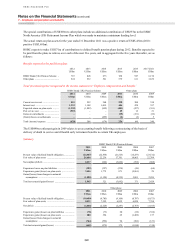
HSBC Holdings
2011 2010 2009
US$m US$m US$m
Net income/(expense) arising on HSBC Holdings long-term debt issued and
related derivatives
– changes in own credit spread on long-term debt ............................................... 1,657 248 (2,612)
– derivatives managed in conjunction with HSBC Holdings issued
debt securities ..................................................................................................... 1,368 (482) (352)
– other changes in fair value ................................................................................. (1,113) 373 201
1,912 139 (2,763)