HSBC 2011 Annual Report Download - page 128
Download and view the complete annual report
Please find page 128 of the 2011 HSBC annual report below. You can navigate through the pages in the report by either clicking on the pages listed below, or by using the keyword search tool below to find specific information within the annual report.-
 1
1 -
2
-
3
-
4
-
5
-
6
-
7
-
8
-
9
-
10
-
11
-
12
-
13
-
14
-
15
-
16
-
17
-
18
-
19
-
20
-
21
-
22
-
23
-
24
-
25
-
26
-
27
-
28
-
29
-
30
-
31
-
32
-
33
-
34
-
35
-
36
-
37
-
38
-
39
-
40
-
41
-
42
-
43
-
44
-
45
-
46
-
47
-
48
-
49
-
50
-
51
-
52
-
53
-
54
-
55
-
56
-
57
-
58
-
59
-
60
-
61
-
62
-
63
-
64
-
65
-
66
-
67
-
68
-
69
-
70
-
71
-
72
-
73
-
74
-
75
-
76
-
77
-
78
-
79
-
80
-
81
-
82
-
83
-
84
-
85
-
86
-
87
-
88
-
89
-
90
-
91
-
92
-
93
-
94
-
95
-
96
-
97
-
98
-
99
-
100
-
101
-
102
-
103
-
104
-
105
-
106
-
107
-
108
-
109
-
110
-
111
-
112
-
113
-
114
-
115
-
116
-
117
-
 118
118 -
 119
119 -
 120
120 -
 121
121 -
 122
122 -
 123
123 -
 124
124 -
 125
125 -
 126
126 -
 127
127 -
 128
128 -
 129
129 -
 130
130 -
 131
131 -
 132
132 -
 133
133 -
 134
134 -
 135
135 -
 136
136 -
 137
137 -
 138
138 -
139
-
140
-
141
-
142
-
143
-
144
-
145
-
146
-
147
-
148
-
149
-
150
-
151
-
152
-
153
-
154
-
155
-
156
-
157
-
158
-
159
-
160
-
161
-
162
-
163
-
164
-
165
-
166
-
167
-
168
-
169
-
170
-
171
-
172
-
173
-
174
-
175
-
176
-
177
-
178
-
179
-
180
-
181
-
182
-
183
-
184
-
185
-
186
-
187
-
188
-
189
-
190
-
191
-
192
-
193
-
194
-
195
-
196
-
197
-
198
-
199
-
200
-
201
-
202
-
203
-
204
-
205
-
206
-
207
-
208
-
209
-
210
-
211
-
212
-
213
-
214
-
215
-
216
-
217
-
218
-
219
-
220
-
221
-
222
-
223
-
224
-
225
-
226
-
227
-
228
-
229
-
230
-
231
-
232
-
233
-
234
-
235
-
236
-
237
-
238
-
239
-
240
-
241
-
242
-
243
-
244
-
245
-
246
-
247
-
248
-
249
-
250
-
251
-
252
-
253
-
254
-
255
-
256
-
257
-
258
-
259
-
260
-
261
-
262
-
263
-
264
-
265
-
266
-
267
-
268
-
269
-
270
-
271
-
272
-
273
-
274
-
275
-
276
-
277
-
278
-
279
-
280
-
281
-
282
-
283
-
284
-
285
-
286
-
287
-
288
-
289
-
290
-
291
-
292
-
293
-
294
-
295
-
296
-
297
-
298
-
299
-
300
-
301
-
302
-
303
-
304
-
305
-
306
-
307
-
308
-
309
-
310
-
311
-
312
-
313
-
314
-
315
-
316
-
317
-
318
-
319
-
320
-
321
-
322
-
323
-
324
-
325
-
326
-
327
-
328
-
329
-
330
-
331
-
332
-
333
-
334
-
335
-
336
-
337
-
338
-
339
-
340
-
341
-
342
-
343
-
344
-
345
-
346
-
347
-
348
-
349
-
350
-
351
-
352
-
353
-
354
-
355
-
356
-
357
-
358
-
359
-
360
-
361
-
362
-
363
-
364
-
365
-
366
-
367
-
368
-
369
-
370
-
371
-
372
-
373
-
374
-
375
-
376
-
377
-
378
-
379
-
380
-
381
-
382
-
383
-
384
-
385
-
386
-
387
-
388
-
389
-
390
-
391
-
392
-
393
-
394
-
395
-
396
-
397
-
398
-
399
-
400
-
401
-
402
-
403
-
404
-
405
-
406
-
407
-
408
-
409
-
410
-
411
-
412
-
413
-
414
-
415
-
416
-
417
-
418
-
419
-
420
-
421
-
422
-
423
-
424
-
425
-
426
-
427
-
428
-
429
-
430
-
431
-
432
-
433
-
434
-
435
-
436
-
437
-
438
-
439
-
440
 |
 |

HSBC HOLDINGS PLC
Report of the Directors: Operating and Financial Review (continued)
Risk > Credit risk > Areas of special interest > US personal lending // Credit quality of financial instruments
126
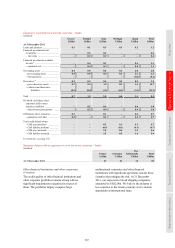
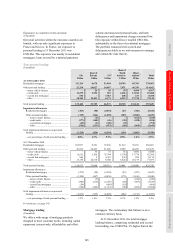
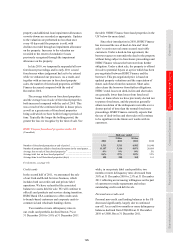
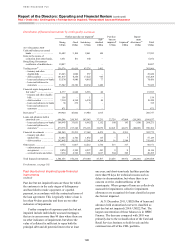
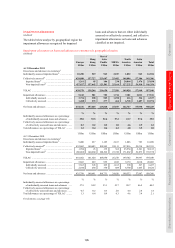
Two months and over contractual delinquency in the US
(Unaudited)
At 31 December
2011 2010 2009
US$m US$m US$m
In Personal Lending in the US
Residential mortgages ................................................................................................ 9,065 8,632 9,551
Of which:
Mortgage services .................................................................................................. 2,783 2,757 3,093
Consumer lending .................................................................................................. 5,139 4,861 5,380
Other mortgage lending .......................................................................................... 1,143 1,014 1,078
Second lien mortgage lending .................................................................................... 674 847 1,194
Of which:
Mortgage services .................................................................................................. 157 245 384
Consumer lending .................................................................................................. 344 423 642
Other mortgage lending .......................................................................................... 173 179 168
Vehicle finance ........................................................................................................... – – 267
Credit card .................................................................................................................. 714 957 1,798
Private label ................................................................................................................ 316 404 622
Personal non-credit card ............................................................................................. 513 811 1,548
Total ............................................................................................................................ 11,282 11,651 14,980
%
18 %
18 %18
Residential mortgages ................................................................................................ 17.1 15.0 14.5
Second lien mortgage lending .................................................................................... 8.5 9.1 10.1
Vehicle finance ........................................................................................................... – – 4.6
Credit card .................................................................................................................. 3.8 4.7 7.4
Private label ................................................................................................................ 2.5 3.0 4.1
Personal non-credit card ............................................................................................. 8.3 9.5 12.6
Total ............................................................................................................................ 11.4 10.7 11.1
For footnote, see page 185.
Credit quality of financial instruments
(Audited)
The five classifications describing the credit quality
of our lending, debt securities portfolios and
derivatives are defined in the Appendix to Risk on
page 188. Additional credit quality information in
respect of our consolidated holdings of ABSs is
provided on page 152.
During 2011, we amended our presentation of
impaired loans for portfolios with significant levels
of forbearance to provide more relevant information
on the effect of forbearance on the credit risk of
loans and advances. This change in presentation does
not affect the accounting policy for the recognition
of loan impairment allowances. Further details are
provided on page 133.
For the purpose of the following disclosure,
retail loans which are past due up to 89 days and are
not otherwise classified as impaired in accordance
with our disclosure convention (see page 133), are
not disclosed within the expected loss (‘EL’) grade
to which they relate, but are separately classified as
past due but not impaired.
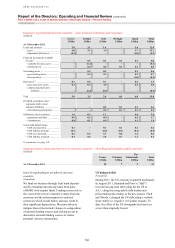
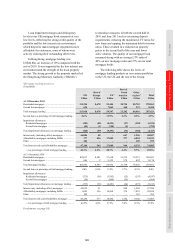
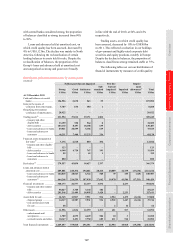
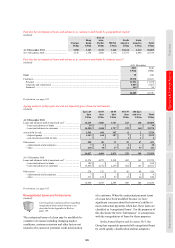
2011 compared with 2010
We assess credit quality on all financial instruments
which are subject to credit risk, as shown in the
table on page 127. The balance of these financial
instruments was US$2,413bn, an increase of 5%
in 2011, of which US$1,649bn or 68% was classified
as strong. This percentage was broadly in line with
2010. The proportion of financial instruments
classified as good and satisfactory remained broadly
stable at 16% and 12%, respectively, while the
proportion of sub-standard financial instruments
was 2% in both 2011 and 2010.
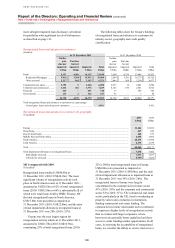
Derivative assets increased by 33% to
US$346bn. This increase was mainly in Europe,
reflecting an increase in the fair value of interest rate
contracts compounded by an increase in the notional
value of outstanding contracts during the period. The
credit quality of our derivatives portfolio remained
strong with 81% of balances in this classification,
broadly in line with 2010.
Cash and balances at central banks, on which
credit quality has been assessed, more than doubled
to US$130bn. This increase was mainly in Europe
and in North America as we deposited a larger
portion of our excess liquidity with central banks in
these regions. As the increases in placements are