HSBC 2011 Annual Report Download - page 185
Download and view the complete annual report
Please find page 185 of the 2011 HSBC annual report below. You can navigate through the pages in the report by either clicking on the pages listed below, or by using the keyword search tool below to find specific information within the annual report.-
 1
1 -
2
-
3
-
4
-
5
-
6
-
7
-
8
-
9
-
10
-
11
-
12
-
13
-
14
-
15
-
16
-
17
-
18
-
19
-
20
-
21
-
22
-
23
-
24
-
25
-
26
-
27
-
28
-
29
-
30
-
31
-
32
-
33
-
34
-
35
-
36
-
37
-
38
-
39
-
40
-
41
-
42
-
43
-
44
-
45
-
46
-
47
-
48
-
49
-
50
-
51
-
52
-
53
-
54
-
55
-
56
-
57
-
58
-
59
-
60
-
61
-
62
-
63
-
64
-
65
-
66
-
67
-
68
-
69
-
70
-
71
-
72
-
73
-
74
-
75
-
76
-
77
-
78
-
79
-
80
-
81
-
82
-
83
-
84
-
85
-
86
-
87
-
88
-
89
-
90
-
91
-
92
-
93
-
94
-
95
-
96
-
97
-
98
-
99
-
100
-
101
-
102
-
103
-
104
-
105
-
106
-
107
-
108
-
109
-
110
-
111
-
112
-
113
-
114
-
115
-
116
-
117
-
118
-
119
-
120
-
121
-
122
-
123
-
124
-
125
-
126
-
127
-
128
-
129
-
130
-
131
-
132
-
133
-
134
-
135
-
136
-
137
-
138
-
139
-
140
-
141
-
142
-
143
-
144
-
145
-
146
-
147
-
148
-
149
-
150
-
151
-
152
-
153
-
154
-
155
-
156
-
157
-
158
-
159
-
160
-
161
-
162
-
163
-
164
-
165
-
166
-
167
-
168
-
169
-
170
-
171
-
172
-
173
-
174
-
 175
175 -
 176
176 -
 177
177 -
 178
178 -
 179
179 -
 180
180 -
 181
181 -
 182
182 -
 183
183 -
 184
184 -
 185
185 -
 186
186 -
 187
187 -
 188
188 -
 189
189 -
 190
190 -
 191
191 -
 192
192 -
 193
193 -
 194
194 -
 195
195 -
196
-
197
-
198
-
199
-
200
-
201
-
202
-
203
-
204
-
205
-
206
-
207
-
208
-
209
-
210
-
211
-
212
-
213
-
214
-
215
-
216
-
217
-
218
-
219
-
220
-
221
-
222
-
223
-
224
-
225
-
226
-
227
-
228
-
229
-
230
-
231
-
232
-
233
-
234
-
235
-
236
-
237
-
238
-
239
-
240
-
241
-
242
-
243
-
244
-
245
-
246
-
247
-
248
-
249
-
250
-
251
-
252
-
253
-
254
-
255
-
256
-
257
-
258
-
259
-
260
-
261
-
262
-
263
-
264
-
265
-
266
-
267
-
268
-
269
-
270
-
271
-
272
-
273
-
274
-
275
-
276
-
277
-
278
-
279
-
280
-
281
-
282
-
283
-
284
-
285
-
286
-
287
-
288
-
289
-
290
-
291
-
292
-
293
-
294
-
295
-
296
-
297
-
298
-
299
-
300
-
301
-
302
-
303
-
304
-
305
-
306
-
307
-
308
-
309
-
310
-
311
-
312
-
313
-
314
-
315
-
316
-
317
-
318
-
319
-
320
-
321
-
322
-
323
-
324
-
325
-
326
-
327
-
328
-
329
-
330
-
331
-
332
-
333
-
334
-
335
-
336
-
337
-
338
-
339
-
340
-
341
-
342
-
343
-
344
-
345
-
346
-
347
-
348
-
349
-
350
-
351
-
352
-
353
-
354
-
355
-
356
-
357
-
358
-
359
-
360
-
361
-
362
-
363
-
364
-
365
-
366
-
367
-
368
-
369
-
370
-
371
-
372
-
373
-
374
-
375
-
376
-
377
-
378
-
379
-
380
-
381
-
382
-
383
-
384
-
385
-
386
-
387
-
388
-
389
-
390
-
391
-
392
-
393
-
394
-
395
-
396
-
397
-
398
-
399
-
400
-
401
-
402
-
403
-
404
-
405
-
406
-
407
-
408
-
409
-
410
-
411
-
412
-
413
-
414
-
415
-
416
-
417
-
418
-
419
-
420
-
421
-
422
-
423
-
424
-
425
-
426
-
427
-
428
-
429
-
430
-
431
-
432
-
433
-
434
-
435
-
436
-
437
-
438
-
439
-
440
 |
 |

183
Overview Operating & Financial Review Corporate Governance Financial Statements Shareholder Information
The cost of claims is a risk associated with non-
life insurance business. An increase in claims costs
would have a negative effect on profit. Our main
exposures to this scenario are in Hong Kong, Latin
America and Bermuda. Sensitivities have decreased
since 2010 due to the non-renewal and transfer to
third parties of certain contracts in our Irish business
as well as the disposal of the motor business in the
UK during 2011.
Mortality and morbidity risk is typically
associated with life insurance contracts. The effect
on profit of an increase in mortality or morbidity
depends on the type of business being written. Our
largest exposures to mortality and morbidity risk
exist in France, Hong Kong and the US.
Sensitivity to lapse rates depends on the type
of contracts being written. For insurance contracts,
claims are funded by premiums received and income
earned on the investment portfolio supporting the
liabilities. For a portfolio of term assurance, an
increase in lapse rates typically has a negative effect
on profit due to the loss of future premium income
on the lapsed policies. France, Hong Kong and the
UK are where we are most sensitive to a change in
lapse rates.
Expense rate risk is the exposure to a change in
expense rates. To the extent that increased expenses
cannot be passed on to policyholders, an increase in
expense rates will have a negative impact on our
profits.
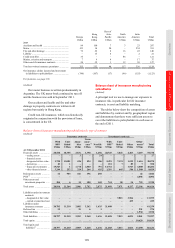
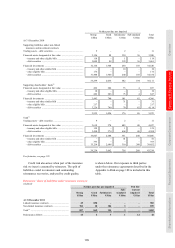
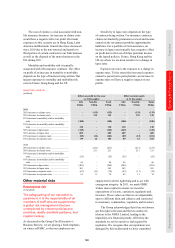
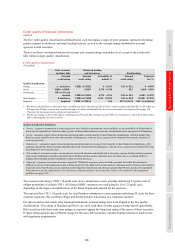
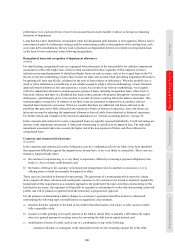
Sensitivity analysis
(Audited)
Effect on profit for the year
to 31 December
Effect on total equity
at 31 December
Life Non-life Total Life Non-life Total
US$m US$m US$m US$m US$m US$m
2011
20% increase in claims costs .............................. – (135) (135) – (135) (135)
20% decrease in claims costs ............................. – 135 135 – 135 135
10% increase in mortality and/or morbidity
rates ................................................................. (100) – (100) (100) – (100)
10% decrease in mortality and/or morbidity
rates ................................................................. 110 – 110 110 – 110
50% increase in lapse rates ................................. (349) – (349) (349) – (349)
50% decrease in lapse rates ................................ 609 – 609 609 – 609
10% increase in expense rates ............................ (89) (12) (101) (89) (12) (101)
10% decrease in expense rates ........................... 89 12 101 89 12 101
2010
20% increase in claims costs .............................. – (211) (211) – (211) (211)
20% decrease in claims costs ............................. – 211 211 – 211 211
10% increase in mortality and/or morbidity
rates ................................................................. (55) – (55) (55) – (55)
10% decrease in mortality and/or morbidity
rates ................................................................. 66 – 66 66 – 66
50% increase in lapse rates ................................. (203) – (203) (203) – (203)
50% decrease in lapse rates ................................ 363 – 363 363 – 363
10% increase in expense rates ............................ (63) (11) (74) (63) (11) (74)
10% decrease in expense rates ........................... 63 11 74 63 11 74
Other material risks
Reputational risk
(Unaudited)
The safeguarding of our reputation is
paramount. It is the responsibility of all
members of staff who are supported by
a global risk management structure
underpinned by relevant policies and
practices, readily available guidance, and
regular training.
As discussed in the Group Chief Executive’s
Business Review, we are placing a fresh emphasis
on values at HSBC, so that our employees are
empowered to do the right thing and to act with
courageous integrity. In 2011, we made HSBC
Values more explicit to ensure we meet the
expectations of society, customers, regulators and
investors. Those values are that we are dependable;
open to different ideas and cultures; and connected
to customers, communities, regulators and investors.
The Group acknowledges that it has not always
got this right in the past and that its conduct in
relation to the NHFA Limited, leading to the
imposition of a financial penalty, fell below the
standards we set for ourselves and required by
regulation. We recognise that our reputation was
damaged by this incident and we have committed