HSBC 2011 Annual Report Download - page 82
Download and view the complete annual report
Please find page 82 of the 2011 HSBC annual report below. You can navigate through the pages in the report by either clicking on the pages listed below, or by using the keyword search tool below to find specific information within the annual report.-
 1
1 -
2
-
3
-
4
-
5
-
6
-
7
-
8
-
9
-
10
-
11
-
12
-
13
-
14
-
15
-
16
-
17
-
18
-
19
-
20
-
21
-
22
-
23
-
24
-
25
-
26
-
27
-
28
-
29
-
30
-
31
-
32
-
33
-
34
-
35
-
36
-
37
-
38
-
39
-
40
-
41
-
42
-
43
-
44
-
45
-
46
-
47
-
48
-
49
-
50
-
51
-
52
-
53
-
54
-
55
-
56
-
57
-
58
-
59
-
60
-
61
-
62
-
63
-
64
-
65
-
66
-
67
-
68
-
69
-
70
-
71
-
 72
72 -
 73
73 -
 74
74 -
 75
75 -
 76
76 -
 77
77 -
 78
78 -
 79
79 -
 80
80 -
 81
81 -
 82
82 -
 83
83 -
 84
84 -
 85
85 -
 86
86 -
 87
87 -
 88
88 -
 89
89 -
 90
90 -
 91
91 -
 92
92 -
93
-
94
-
95
-
96
-
97
-
98
-
99
-
100
-
101
-
102
-
103
-
104
-
105
-
106
-
107
-
108
-
109
-
110
-
111
-
112
-
113
-
114
-
115
-
116
-
117
-
118
-
119
-
120
-
121
-
122
-
123
-
124
-
125
-
126
-
127
-
128
-
129
-
130
-
131
-
132
-
133
-
134
-
135
-
136
-
137
-
138
-
139
-
140
-
141
-
142
-
143
-
144
-
145
-
146
-
147
-
148
-
149
-
150
-
151
-
152
-
153
-
154
-
155
-
156
-
157
-
158
-
159
-
160
-
161
-
162
-
163
-
164
-
165
-
166
-
167
-
168
-
169
-
170
-
171
-
172
-
173
-
174
-
175
-
176
-
177
-
178
-
179
-
180
-
181
-
182
-
183
-
184
-
185
-
186
-
187
-
188
-
189
-
190
-
191
-
192
-
193
-
194
-
195
-
196
-
197
-
198
-
199
-
200
-
201
-
202
-
203
-
204
-
205
-
206
-
207
-
208
-
209
-
210
-
211
-
212
-
213
-
214
-
215
-
216
-
217
-
218
-
219
-
220
-
221
-
222
-
223
-
224
-
225
-
226
-
227
-
228
-
229
-
230
-
231
-
232
-
233
-
234
-
235
-
236
-
237
-
238
-
239
-
240
-
241
-
242
-
243
-
244
-
245
-
246
-
247
-
248
-
249
-
250
-
251
-
252
-
253
-
254
-
255
-
256
-
257
-
258
-
259
-
260
-
261
-
262
-
263
-
264
-
265
-
266
-
267
-
268
-
269
-
270
-
271
-
272
-
273
-
274
-
275
-
276
-
277
-
278
-
279
-
280
-
281
-
282
-
283
-
284
-
285
-
286
-
287
-
288
-
289
-
290
-
291
-
292
-
293
-
294
-
295
-
296
-
297
-
298
-
299
-
300
-
301
-
302
-
303
-
304
-
305
-
306
-
307
-
308
-
309
-
310
-
311
-
312
-
313
-
314
-
315
-
316
-
317
-
318
-
319
-
320
-
321
-
322
-
323
-
324
-
325
-
326
-
327
-
328
-
329
-
330
-
331
-
332
-
333
-
334
-
335
-
336
-
337
-
338
-
339
-
340
-
341
-
342
-
343
-
344
-
345
-
346
-
347
-
348
-
349
-
350
-
351
-
352
-
353
-
354
-
355
-
356
-
357
-
358
-
359
-
360
-
361
-
362
-
363
-
364
-
365
-
366
-
367
-
368
-
369
-
370
-
371
-
372
-
373
-
374
-
375
-
376
-
377
-
378
-
379
-
380
-
381
-
382
-
383
-
384
-
385
-
386
-
387
-
388
-
389
-
390
-
391
-
392
-
393
-
394
-
395
-
396
-
397
-
398
-
399
-
400
-
401
-
402
-
403
-
404
-
405
-
406
-
407
-
408
-
409
-
410
-
411
-
412
-
413
-
414
-
415
-
416
-
417
-
418
-
419
-
420
-
421
-
422
-
423
-
424
-
425
-
426
-
427
-
428
-
429
-
430
-
431
-
432
-
433
-
434
-
435
-
436
-
437
-
438
-
439
-
440
 |
 |

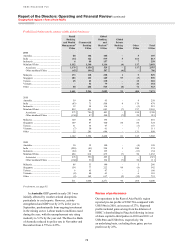
HSBC HOLDINGS PLC
Report of the Directors: Operating and Financial Review (continued)
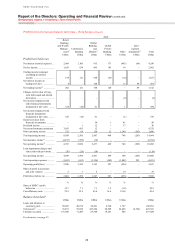
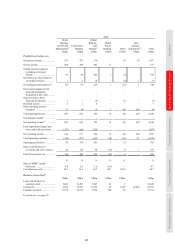
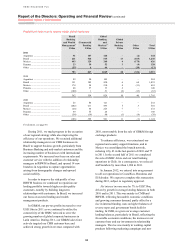
Geographical regions > Middle East and North Africa
80
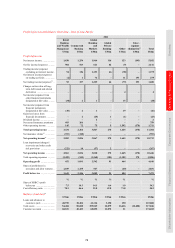
Profit/(loss) before tax and balance sheet data – Middle East and North Africa
2011
Retail
Banking
and Wealth
Management
US$m
Commercial
Banking
US$m
Global
Banking
and
Markets
US$m
Global
Private
Banking
US$m
Other
US$m
Inter-
segment
elimination64
US$m
Total
US$m
Profit/(loss) before tax
Net interest income ..................... 589 496 371 2 2 (28) 1,432
Net fee income/(expense) ........... 173 271 173 13 (3) – 627
Trading income/(expense)
excluding net interest
income .................................... 62 95 266 1 (1) – 423
Net interest income/(expense)
on trading activities ................ – – 32 –(1) 28 59
Net trading income/(expense)56 ... 62 95 298 1 (2) 28 482
Net income from financial
instruments designated at
fair value ................................. – – – – 10 – 10
Gains less losses from
financial investments .............. 1 1 (7) – (3) – (8)
Dividend income ......................... 1 1 3 – – – 5
Other operating income/
(expense) ................................ 22 11 11 (1) 124 (108) 59
Total operating income ............ 848 875 849 15 128 (108) 2,607
Net insurance claims65 ................ – – – – – – –
Net operating income52 ............. 848 875 849 15 128 (108) 2,607
Loan impairment charges and
other credit risk provisions ..... (126) (116) (51) – – – (293)
Net operating income ............... 722 759 798 15 128 (108) 2,314
Total operating expenses ............ (535) (320) (295) (21) (96) 108 (1,159)
Operating profit/(loss) .............. 187 439 503 (6) 32 – 1,155
Share of profit in associates
and joint ventures ................... 60 98 140 4 35 – 337
Profit/(loss) before tax .............. 247 537 643 (2) 67 – 1,492
% % % % % %
Share of HSBC’s profit
before tax ................................ 1.1 2.5 2.9 – 0.3 6.8
Cost efficiency ratio ................... 63.1 36.6 34.7 140.0 75.0 44.5
Balance sheet data49
US$m US$m US$m US$m US$m US$m
Loans and advances to
customers (net) ....................... 4,921 12,446 8,479 26 3 25,875
Total assets ................................. 6,549 14,556 34,676 72 4,792 (3,181) 57,464
Customer accounts ...................... 18,549 10,943 6,703 114 113 36,422