HSBC 2011 Annual Report Download - page 152
Download and view the complete annual report
Please find page 152 of the 2011 HSBC annual report below. You can navigate through the pages in the report by either clicking on the pages listed below, or by using the keyword search tool below to find specific information within the annual report.-
 1
1 -
2
-
3
-
4
-
5
-
6
-
7
-
8
-
9
-
10
-
11
-
12
-
13
-
14
-
15
-
16
-
17
-
18
-
19
-
20
-
21
-
22
-
23
-
24
-
25
-
26
-
27
-
28
-
29
-
30
-
31
-
32
-
33
-
34
-
35
-
36
-
37
-
38
-
39
-
40
-
41
-
42
-
43
-
44
-
45
-
46
-
47
-
48
-
49
-
50
-
51
-
52
-
53
-
54
-
55
-
56
-
57
-
58
-
59
-
60
-
61
-
62
-
63
-
64
-
65
-
66
-
67
-
68
-
69
-
70
-
71
-
72
-
73
-
74
-
75
-
76
-
77
-
78
-
79
-
80
-
81
-
82
-
83
-
84
-
85
-
86
-
87
-
88
-
89
-
90
-
91
-
92
-
93
-
94
-
95
-
96
-
97
-
98
-
99
-
100
-
101
-
102
-
103
-
104
-
105
-
106
-
107
-
108
-
109
-
110
-
111
-
112
-
113
-
114
-
115
-
116
-
117
-
118
-
119
-
120
-
121
-
122
-
123
-
124
-
125
-
126
-
127
-
128
-
129
-
130
-
131
-
132
-
133
-
134
-
135
-
136
-
137
-
138
-
139
-
140
-
141
-
 142
142 -
 143
143 -
 144
144 -
 145
145 -
 146
146 -
 147
147 -
 148
148 -
 149
149 -
 150
150 -
 151
151 -
 152
152 -
 153
153 -
 154
154 -
 155
155 -
 156
156 -
 157
157 -
 158
158 -
 159
159 -
 160
160 -
 161
161 -
 162
162 -
163
-
164
-
165
-
166
-
167
-
168
-
169
-
170
-
171
-
172
-
173
-
174
-
175
-
176
-
177
-
178
-
179
-
180
-
181
-
182
-
183
-
184
-
185
-
186
-
187
-
188
-
189
-
190
-
191
-
192
-
193
-
194
-
195
-
196
-
197
-
198
-
199
-
200
-
201
-
202
-
203
-
204
-
205
-
206
-
207
-
208
-
209
-
210
-
211
-
212
-
213
-
214
-
215
-
216
-
217
-
218
-
219
-
220
-
221
-
222
-
223
-
224
-
225
-
226
-
227
-
228
-
229
-
230
-
231
-
232
-
233
-
234
-
235
-
236
-
237
-
238
-
239
-
240
-
241
-
242
-
243
-
244
-
245
-
246
-
247
-
248
-
249
-
250
-
251
-
252
-
253
-
254
-
255
-
256
-
257
-
258
-
259
-
260
-
261
-
262
-
263
-
264
-
265
-
266
-
267
-
268
-
269
-
270
-
271
-
272
-
273
-
274
-
275
-
276
-
277
-
278
-
279
-
280
-
281
-
282
-
283
-
284
-
285
-
286
-
287
-
288
-
289
-
290
-
291
-
292
-
293
-
294
-
295
-
296
-
297
-
298
-
299
-
300
-
301
-
302
-
303
-
304
-
305
-
306
-
307
-
308
-
309
-
310
-
311
-
312
-
313
-
314
-
315
-
316
-
317
-
318
-
319
-
320
-
321
-
322
-
323
-
324
-
325
-
326
-
327
-
328
-
329
-
330
-
331
-
332
-
333
-
334
-
335
-
336
-
337
-
338
-
339
-
340
-
341
-
342
-
343
-
344
-
345
-
346
-
347
-
348
-
349
-
350
-
351
-
352
-
353
-
354
-
355
-
356
-
357
-
358
-
359
-
360
-
361
-
362
-
363
-
364
-
365
-
366
-
367
-
368
-
369
-
370
-
371
-
372
-
373
-
374
-
375
-
376
-
377
-
378
-
379
-
380
-
381
-
382
-
383
-
384
-
385
-
386
-
387
-
388
-
389
-
390
-
391
-
392
-
393
-
394
-
395
-
396
-
397
-
398
-
399
-
400
-
401
-
402
-
403
-
404
-
405
-
406
-
407
-
408
-
409
-
410
-
411
-
412
-
413
-
414
-
415
-
416
-
417
-
418
-
419
-
420
-
421
-
422
-
423
-
424
-
425
-
426
-
427
-
428
-
429
-
430
-
431
-
432
-
433
-
434
-
435
-
436
-
437
-
438
-
439
-
440
 |
 |
HSBC HOLDINGS PLC
Report of the Directors: Operating and Financial Review (continued)
Risk > Credit risk > Securitisation exposures and other structured products
150
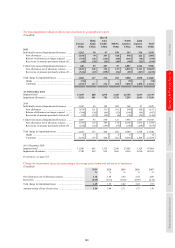
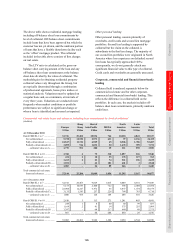
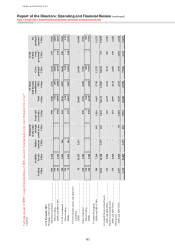
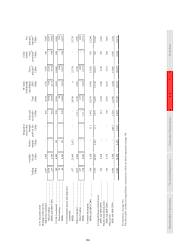
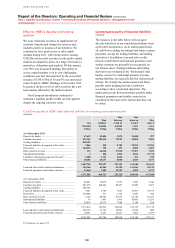
Overall exposure of HSBC
(Audited)
At 31 December 2011 At 31 December 2010
Carrying
amount33
Including
sub-prime
and Alt-A
Carrying
amount33
Including
sub-prime
and Alt-A
US$bn US$bn US$bn US$bn
Asset-backed securities (‘ABS’s) ............................................................. 65.6 6.9 73.9 8.5
– fair value through profit or loss ........................................................ 3.0 0.2 10.8 0.3
– available for sale34 ............................................................................. 54.6 5.7 54.7 7.1
– held to maturity34 ............................................................................... 2.0 0.2 2.2 0.2
– loans and receivables ......................................................................... 6.0 0.8 6.2 0.9
Direct lending at fair value through profit or loss .................................... 1.2 0.8 1.6 1.2
Total ABSs and direct lending at fair value through profit or loss .......... 66.8 7.7 75.5 9.7
Less securities subject to risk mitigation from credit derivatives with
monolines and other financial institutions ........................................... (1.9) (0.2) (8.3) (0.4)
64.9 7.5 67.2 9.3
Leveraged finance loans ........................................................................... 3.6 – 4.9 –
– fair value through profit or loss ........................................................ 0.2 – 0.3 –
– loans and receivables ......................................................................... 3.4 – 4.6 –
68.5 7.5 72.1 9.3
Exposure including securities mitigated by credit derivatives
with monolines and other financial institutions ................................... 70.4 7.7 80.4 9.7
For footnotes, see page 185.
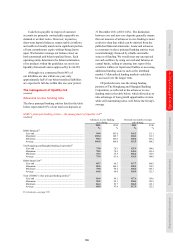
ABSs classified as available for sale
Our principal holdings of available-for-sale ABSs
are in GB&M through special purpose entities
(‘SPE’s) which were established from the outset
with the benefit of external investor first loss
protection support, together with positions held
directly and by Solitaire, where we provide first loss
protection of US$1.2bn through credit enhancement
and a liquidity facility.
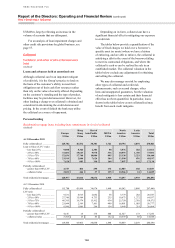
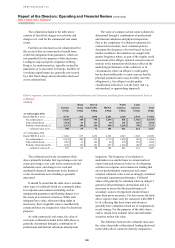
Movement in the available-for-sale reserve
(Audited)
2011 2010
Directly
held/
Solitaire35 SPEs Total
Directly
held/
Solitaire35 SPEs Total
US$m US$m US$m US$m US$m US$m
Available-for-sale reserve at 1 January .............. (4,102) (2,306) (6,408) (7,349) (4,864) (12,213)
Increase/(decrease) in fair value of securities .... 622 (137) 485 2,175 1,543 3,718
Impairment charge:
– borne by HSBC .......................................... 383 26 409 444 – 444
– allocated to capital note holders36 .............. – 313 313 – 531 531
Repayment of capital .......................................... 162 183 345 540 187 727
Other movements ................................................ (150) (140) (290) 88 297 385
Available-for-sale reserve at 31 December ........ (3,085) (2,061) (5,146) (4,102) (2,306) (6,408)
For footnotes, see page 185.
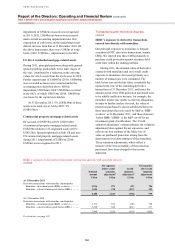
Securities investment conduits
(Audited)
The total carrying amount of ABSs held through
SPEs in the above table represents holdings in
which significant first loss protection is provided
through capital notes issued by SICs, excluding
Solitaire.
At each reporting date, we assess whether there
is any objective evidence of impairment in the
value of the ABSs held by SPEs. Impairment
charges incurred on these assets are offset by a
credit to the impairment line for the amount of the
loss allocated to capital note holders, subject to
the carrying amount of the capital notes being
sufficient to offset the loss. During the year