HSBC 2011 Annual Report Download - page 60
Download and view the complete annual report
Please find page 60 of the 2011 HSBC annual report below. You can navigate through the pages in the report by either clicking on the pages listed below, or by using the keyword search tool below to find specific information within the annual report.-
 1
1 -
2
-
3
-
4
-
5
-
6
-
7
-
8
-
9
-
10
-
11
-
12
-
13
-
14
-
15
-
16
-
17
-
18
-
19
-
20
-
21
-
22
-
23
-
24
-
25
-
26
-
27
-
28
-
29
-
30
-
31
-
32
-
33
-
34
-
35
-
36
-
37
-
38
-
39
-
40
-
41
-
42
-
43
-
44
-
45
-
46
-
47
-
48
-
49
-
 50
50 -
 51
51 -
 52
52 -
 53
53 -
 54
54 -
 55
55 -
 56
56 -
 57
57 -
 58
58 -
 59
59 -
 60
60 -
 61
61 -
 62
62 -
 63
63 -
 64
64 -
 65
65 -
 66
66 -
 67
67 -
 68
68 -
 69
69 -
 70
70 -
71
-
72
-
73
-
74
-
75
-
76
-
77
-
78
-
79
-
80
-
81
-
82
-
83
-
84
-
85
-
86
-
87
-
88
-
89
-
90
-
91
-
92
-
93
-
94
-
95
-
96
-
97
-
98
-
99
-
100
-
101
-
102
-
103
-
104
-
105
-
106
-
107
-
108
-
109
-
110
-
111
-
112
-
113
-
114
-
115
-
116
-
117
-
118
-
119
-
120
-
121
-
122
-
123
-
124
-
125
-
126
-
127
-
128
-
129
-
130
-
131
-
132
-
133
-
134
-
135
-
136
-
137
-
138
-
139
-
140
-
141
-
142
-
143
-
144
-
145
-
146
-
147
-
148
-
149
-
150
-
151
-
152
-
153
-
154
-
155
-
156
-
157
-
158
-
159
-
160
-
161
-
162
-
163
-
164
-
165
-
166
-
167
-
168
-
169
-
170
-
171
-
172
-
173
-
174
-
175
-
176
-
177
-
178
-
179
-
180
-
181
-
182
-
183
-
184
-
185
-
186
-
187
-
188
-
189
-
190
-
191
-
192
-
193
-
194
-
195
-
196
-
197
-
198
-
199
-
200
-
201
-
202
-
203
-
204
-
205
-
206
-
207
-
208
-
209
-
210
-
211
-
212
-
213
-
214
-
215
-
216
-
217
-
218
-
219
-
220
-
221
-
222
-
223
-
224
-
225
-
226
-
227
-
228
-
229
-
230
-
231
-
232
-
233
-
234
-
235
-
236
-
237
-
238
-
239
-
240
-
241
-
242
-
243
-
244
-
245
-
246
-
247
-
248
-
249
-
250
-
251
-
252
-
253
-
254
-
255
-
256
-
257
-
258
-
259
-
260
-
261
-
262
-
263
-
264
-
265
-
266
-
267
-
268
-
269
-
270
-
271
-
272
-
273
-
274
-
275
-
276
-
277
-
278
-
279
-
280
-
281
-
282
-
283
-
284
-
285
-
286
-
287
-
288
-
289
-
290
-
291
-
292
-
293
-
294
-
295
-
296
-
297
-
298
-
299
-
300
-
301
-
302
-
303
-
304
-
305
-
306
-
307
-
308
-
309
-
310
-
311
-
312
-
313
-
314
-
315
-
316
-
317
-
318
-
319
-
320
-
321
-
322
-
323
-
324
-
325
-
326
-
327
-
328
-
329
-
330
-
331
-
332
-
333
-
334
-
335
-
336
-
337
-
338
-
339
-
340
-
341
-
342
-
343
-
344
-
345
-
346
-
347
-
348
-
349
-
350
-
351
-
352
-
353
-
354
-
355
-
356
-
357
-
358
-
359
-
360
-
361
-
362
-
363
-
364
-
365
-
366
-
367
-
368
-
369
-
370
-
371
-
372
-
373
-
374
-
375
-
376
-
377
-
378
-
379
-
380
-
381
-
382
-
383
-
384
-
385
-
386
-
387
-
388
-
389
-
390
-
391
-
392
-
393
-
394
-
395
-
396
-
397
-
398
-
399
-
400
-
401
-
402
-
403
-
404
-
405
-
406
-
407
-
408
-
409
-
410
-
411
-
412
-
413
-
414
-
415
-
416
-
417
-
418
-
419
-
420
-
421
-
422
-
423
-
424
-
425
-
426
-
427
-
428
-
429
-
430
-
431
-
432
-
433
-
434
-
435
-
436
-
437
-
438
-
439
-
440
 |
 |

HSBC HOLDINGS PLC
Report of the Directors: Operating and Financial Review (continued)
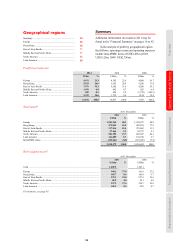
Global businesses > Analysis // Geographical regions > Summary
58
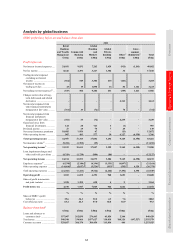
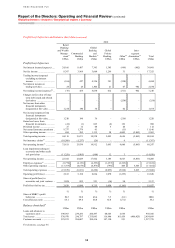
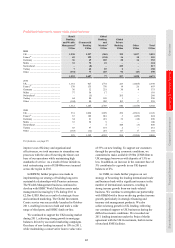
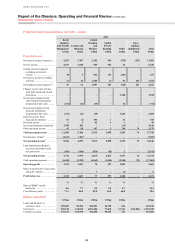
Profit/(loss) before tax and balance sheet data (continued)
2010
Retail
Banking
and Wealth
Manage-
ment17
US$m
Commercial
Banking
US$m
Global
Banking
and
Markets17
US$m
Global
Private
Banking
US$m
Other48
US$m
Inter-
segment
elimination64
US$m
Total
US$m
Profit/(loss) before tax
Net interest income/(expense) .... 24,166 8,487 7,343 1,345 (998) (902) 39,441
Net fee income ............................ 8,397 3,964 3,664 1,299 31 – 17,355
Trading income/(expense)
excluding net interest
income .................................... (106) 427 4,326 391 (358) – 4,680
Net interest income on
trading activities ..................... 28 28 1,504 21 47 902 2,530
Net trading income/(expense)56 .. (78) 455 5,830 412 (311) 902 7,210
Changes in fair value of long-
term debt issued and related
derivatives .............................. – – – – (258) – (258)
Net income from other
financial instruments
designated at fair value ........... 1,210 190 36 – 42 – 1,478
Net income/(expense) from
financial instruments
designated at fair value ........... 1,210 190 36 – (216) – 1,220
Gains less losses from
financial investments .............. (24) (1) 863 (6) 136 – 968
Dividend income ......................... 27 12 48 5 20 – 112
Net earned insurance premiums . 9,737 1,379 41 – (11) – 11,146
Other operating income .............. 684 585 1,113 38 6,005 (5,863) 2,562
Total operating income ............... 44,119 15,071 18,938 3,093 4,656 (5,863) 80,014
Net insurance claims65 ................ (10,508) (1,237) (26) – 4 – (11,767)
Net operating income52 ............... 33,611 13,834 18,912 3,093 4,660 (5,863) 68,247
Loan impairment (charges)/
recoveries and other credit
risk provisions ........................ (11,259) (1,805) (990) 12 3 – (14,039)
Net operating income ................. 22,352 12,029 17,922 3,105 4,663 (5,863) 54,208
Employee expenses66 .................. (5,770) (2,153) (4,353) (1,237) (6,323) – (19,836)
Other operating expenses ........... (13,769) (4,678) (4,875) (798) 405 5,863 (17,852)
Total operating expenses ............ (19,539) (6,831) (9,228) (2,035) (5,918) 5,863 (37,688)
Operating profit/(loss) ................ 2,813 5,198 8,694 1,070 (1,255) – 16,520
Share of profit/(loss) in
associates and joint ventures .. 1,026 892 521 (16) 94 – 2,517
Profit/(loss) before tax ................ 3,839 6,090 9,215 1,054 (1,161) – 19,037
% % % % % %
Share of HSBC’s profit
before tax ................................ 20.2 32.0 48.4 5.5 (6.1) 100.0
Cost efficiency ratio ................... 58.1 49.4 48.8 65.8 127.0 55.2
Balance sheet data49
US$m US$m US$m US$m US$m US$m
Loans and advances to
customers (net) ....................... 390,963 239,286 284,497 40,665 2,955 958,366
Total assets ................................. 530,970 296,797 1,755,043 116,846 161,458 (406,425) 2,454,689
Customer accounts ...................... 525,221 286,007 308,416 107,130 951 1,227,725
For footnotes, see page 95.