HSBC 2011 Annual Report Download - page 23
Download and view the complete annual report
Please find page 23 of the 2011 HSBC annual report below. You can navigate through the pages in the report by either clicking on the pages listed below, or by using the keyword search tool below to find specific information within the annual report.-
 1
1 -
2
-
3
-
4
-
5
-
6
-
7
-
8
-
9
-
10
-
11
-
12
-
 13
13 -
 14
14 -
 15
15 -
 16
16 -
 17
17 -
 18
18 -
 19
19 -
 20
20 -
 21
21 -
 22
22 -
 23
23 -
 24
24 -
 25
25 -
 26
26 -
 27
27 -
 28
28 -
 29
29 -
 30
30 -
 31
31 -
 32
32 -
 33
33 -
34
-
35
-
36
-
37
-
38
-
39
-
40
-
41
-
42
-
43
-
44
-
45
-
46
-
47
-
48
-
49
-
50
-
51
-
52
-
53
-
54
-
55
-
56
-
57
-
58
-
59
-
60
-
61
-
62
-
63
-
64
-
65
-
66
-
67
-
68
-
69
-
70
-
71
-
72
-
73
-
74
-
75
-
76
-
77
-
78
-
79
-
80
-
81
-
82
-
83
-
84
-
85
-
86
-
87
-
88
-
89
-
90
-
91
-
92
-
93
-
94
-
95
-
96
-
97
-
98
-
99
-
100
-
101
-
102
-
103
-
104
-
105
-
106
-
107
-
108
-
109
-
110
-
111
-
112
-
113
-
114
-
115
-
116
-
117
-
118
-
119
-
120
-
121
-
122
-
123
-
124
-
125
-
126
-
127
-
128
-
129
-
130
-
131
-
132
-
133
-
134
-
135
-
136
-
137
-
138
-
139
-
140
-
141
-
142
-
143
-
144
-
145
-
146
-
147
-
148
-
149
-
150
-
151
-
152
-
153
-
154
-
155
-
156
-
157
-
158
-
159
-
160
-
161
-
162
-
163
-
164
-
165
-
166
-
167
-
168
-
169
-
170
-
171
-
172
-
173
-
174
-
175
-
176
-
177
-
178
-
179
-
180
-
181
-
182
-
183
-
184
-
185
-
186
-
187
-
188
-
189
-
190
-
191
-
192
-
193
-
194
-
195
-
196
-
197
-
198
-
199
-
200
-
201
-
202
-
203
-
204
-
205
-
206
-
207
-
208
-
209
-
210
-
211
-
212
-
213
-
214
-
215
-
216
-
217
-
218
-
219
-
220
-
221
-
222
-
223
-
224
-
225
-
226
-
227
-
228
-
229
-
230
-
231
-
232
-
233
-
234
-
235
-
236
-
237
-
238
-
239
-
240
-
241
-
242
-
243
-
244
-
245
-
246
-
247
-
248
-
249
-
250
-
251
-
252
-
253
-
254
-
255
-
256
-
257
-
258
-
259
-
260
-
261
-
262
-
263
-
264
-
265
-
266
-
267
-
268
-
269
-
270
-
271
-
272
-
273
-
274
-
275
-
276
-
277
-
278
-
279
-
280
-
281
-
282
-
283
-
284
-
285
-
286
-
287
-
288
-
289
-
290
-
291
-
292
-
293
-
294
-
295
-
296
-
297
-
298
-
299
-
300
-
301
-
302
-
303
-
304
-
305
-
306
-
307
-
308
-
309
-
310
-
311
-
312
-
313
-
314
-
315
-
316
-
317
-
318
-
319
-
320
-
321
-
322
-
323
-
324
-
325
-
326
-
327
-
328
-
329
-
330
-
331
-
332
-
333
-
334
-
335
-
336
-
337
-
338
-
339
-
340
-
341
-
342
-
343
-
344
-
345
-
346
-
347
-
348
-
349
-
350
-
351
-
352
-
353
-
354
-
355
-
356
-
357
-
358
-
359
-
360
-
361
-
362
-
363
-
364
-
365
-
366
-
367
-
368
-
369
-
370
-
371
-
372
-
373
-
374
-
375
-
376
-
377
-
378
-
379
-
380
-
381
-
382
-
383
-
384
-
385
-
386
-
387
-
388
-
389
-
390
-
391
-
392
-
393
-
394
-
395
-
396
-
397
-
398
-
399
-
400
-
401
-
402
-
403
-
404
-
405
-
406
-
407
-
408
-
409
-
410
-
411
-
412
-
413
-
414
-
415
-
416
-
417
-
418
-
419
-
420
-
421
-
422
-
423
-
424
-
425
-
426
-
427
-
428
-
429
-
430
-
431
-
432
-
433
-
434
-
435
-
436
-
437
-
438
-
439
-
440
 |
 |

21
Overview Operating & Financial Review Corporate Governance Financial Statements Shareholder Information
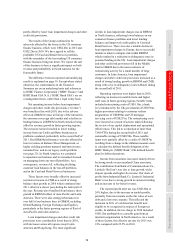
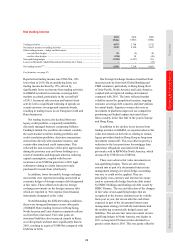
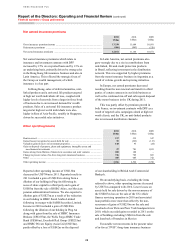
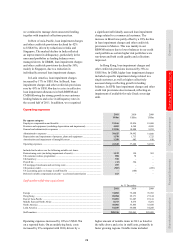
GB&M, as well as strong mortgage lending growth
in our RBWM businesses in the UK, Hong Kong and
Rest of Asia-Pacific throughout both years. During
the year, we announced the sale of 195 non-strategic
branches and our Cards and Retail Services business
in the US, and reclassified the related loans and
advances to customers to other assets held for sale,
reported within ‘Other interest-earning assets’. This,
together with the continued decline in the consumer
finance portfolios in run-off, partly offset the rise in
average lending balances in other regions.
The benefit to interest income of the strong
customer lending volume growth was offset in part
by a reduction in gross yields from loans and
advances to customers. This reflected the transfer of
balances to assets held for sale, including higher
yielding unsecured lending, the continued decline
within the US consumer finance portfolios and the
repositioning of RBWM towards higher quality
secured lending, particularly mortgages, together
with intense competition in certain markets.
Interest income from short-term funds and loans
and advances to banks also increased, attributable to
higher average balances with central banks. This
reflected higher deposit requirements by central
banks in certain markets, together with the placement
of excess liquidity in Asia with central banks.
Interest income from short-term funds and loans and
advances to banks, as well as financial investments,
also benefited from higher yields as interest rates
rose, particularly in mainland China, India and
Brazil.
Interest income from other interest earning
assets rose as a result of the reclassification of assets
held for sale and the related income.
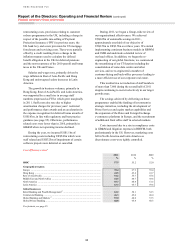
The rise in interest income was largely offset
by higher interest expense. This was driven by a
significant increase in average customer account
balances in Hong Kong, Rest of Asia-Pacific and
Europe as a result of targeted deposit campaigns.
The cost of funds also rose as a result of base rate
increases, notably in mainland China, India and
Brazil, and competitive pricing to attract and retain
deposits in many markets.
The increase in interest expense on deposits
by banks was driven by a rise in the cost of funds in
Europe, reflecting the maturity of derivatives used to
hedge interest rate risk and their replacement at
lower prevailing interest rates.
The interest expense on own debt designated at
fair value also rose, reflecting the volume of new
issuances during the year. Although the average
balance of debt securities in issue declined due to
maturities not being replaced in North America and
Europe, the related interest expense increased as a
result of a general widening of credit spreads in the
financial sector.
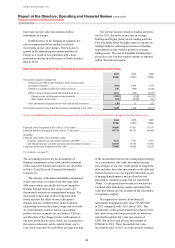
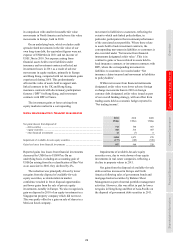
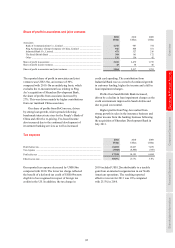
‘Net interest income’ includes the expense of
internally funding trading assets, while related
revenue is reported in ‘Net trading income’. The
internal cost of funding these assets rose due to the
increase in average trading assets during the year. In
reporting our global business results, this cost is
included within ‘Net trading income’.
The decrease in the net interest spread compared
with 2010 was attributable to lower yields on loans
and advances to customers as we continued to target
higher quality assets, coupled with a rising cost of
funds on customer accounts. Our net interest margin
also fell, but by a lesser amount, due to the benefit
from net free funds. This benefit rose as a result of
the increase in the Group’s cost of funds, coupled
with higher third party funding of our trading book,
in line with the growth of trading assets.