HSBC 2011 Annual Report Download - page 107
Download and view the complete annual report
Please find page 107 of the 2011 HSBC annual report below. You can navigate through the pages in the report by either clicking on the pages listed below, or by using the keyword search tool below to find specific information within the annual report.-
 1
1 -
2
-
3
-
4
-
5
-
6
-
7
-
8
-
9
-
10
-
11
-
12
-
13
-
14
-
15
-
16
-
17
-
18
-
19
-
20
-
21
-
22
-
23
-
24
-
25
-
26
-
27
-
28
-
29
-
30
-
31
-
32
-
33
-
34
-
35
-
36
-
37
-
38
-
39
-
40
-
41
-
42
-
43
-
44
-
45
-
46
-
47
-
48
-
49
-
50
-
51
-
52
-
53
-
54
-
55
-
56
-
57
-
58
-
59
-
60
-
61
-
62
-
63
-
64
-
65
-
66
-
67
-
68
-
69
-
70
-
71
-
72
-
73
-
74
-
75
-
76
-
77
-
78
-
79
-
80
-
81
-
82
-
83
-
84
-
85
-
86
-
87
-
88
-
89
-
90
-
91
-
92
-
93
-
94
-
95
-
96
-
 97
97 -
 98
98 -
 99
99 -
 100
100 -
 101
101 -
 102
102 -
 103
103 -
 104
104 -
 105
105 -
 106
106 -
 107
107 -
 108
108 -
 109
109 -
 110
110 -
 111
111 -
 112
112 -
 113
113 -
 114
114 -
 115
115 -
 116
116 -
 117
117 -
118
-
119
-
120
-
121
-
122
-
123
-
124
-
125
-
126
-
127
-
128
-
129
-
130
-
131
-
132
-
133
-
134
-
135
-
136
-
137
-
138
-
139
-
140
-
141
-
142
-
143
-
144
-
145
-
146
-
147
-
148
-
149
-
150
-
151
-
152
-
153
-
154
-
155
-
156
-
157
-
158
-
159
-
160
-
161
-
162
-
163
-
164
-
165
-
166
-
167
-
168
-
169
-
170
-
171
-
172
-
173
-
174
-
175
-
176
-
177
-
178
-
179
-
180
-
181
-
182
-
183
-
184
-
185
-
186
-
187
-
188
-
189
-
190
-
191
-
192
-
193
-
194
-
195
-
196
-
197
-
198
-
199
-
200
-
201
-
202
-
203
-
204
-
205
-
206
-
207
-
208
-
209
-
210
-
211
-
212
-
213
-
214
-
215
-
216
-
217
-
218
-
219
-
220
-
221
-
222
-
223
-
224
-
225
-
226
-
227
-
228
-
229
-
230
-
231
-
232
-
233
-
234
-
235
-
236
-
237
-
238
-
239
-
240
-
241
-
242
-
243
-
244
-
245
-
246
-
247
-
248
-
249
-
250
-
251
-
252
-
253
-
254
-
255
-
256
-
257
-
258
-
259
-
260
-
261
-
262
-
263
-
264
-
265
-
266
-
267
-
268
-
269
-
270
-
271
-
272
-
273
-
274
-
275
-
276
-
277
-
278
-
279
-
280
-
281
-
282
-
283
-
284
-
285
-
286
-
287
-
288
-
289
-
290
-
291
-
292
-
293
-
294
-
295
-
296
-
297
-
298
-
299
-
300
-
301
-
302
-
303
-
304
-
305
-
306
-
307
-
308
-
309
-
310
-
311
-
312
-
313
-
314
-
315
-
316
-
317
-
318
-
319
-
320
-
321
-
322
-
323
-
324
-
325
-
326
-
327
-
328
-
329
-
330
-
331
-
332
-
333
-
334
-
335
-
336
-
337
-
338
-
339
-
340
-
341
-
342
-
343
-
344
-
345
-
346
-
347
-
348
-
349
-
350
-
351
-
352
-
353
-
354
-
355
-
356
-
357
-
358
-
359
-
360
-
361
-
362
-
363
-
364
-
365
-
366
-
367
-
368
-
369
-
370
-
371
-
372
-
373
-
374
-
375
-
376
-
377
-
378
-
379
-
380
-
381
-
382
-
383
-
384
-
385
-
386
-
387
-
388
-
389
-
390
-
391
-
392
-
393
-
394
-
395
-
396
-
397
-
398
-
399
-
400
-
401
-
402
-
403
-
404
-
405
-
406
-
407
-
408
-
409
-
410
-
411
-
412
-
413
-
414
-
415
-
416
-
417
-
418
-
419
-
420
-
421
-
422
-
423
-
424
-
425
-
426
-
427
-
428
-
429
-
430
-
431
-
432
-
433
-
434
-
435
-
436
-
437
-
438
-
439
-
440
 |
 |

105
Overview Operating & Financial Review Corporate Governance Financial Statements Shareholder Information
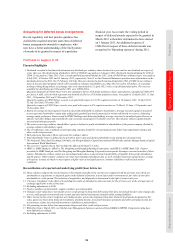
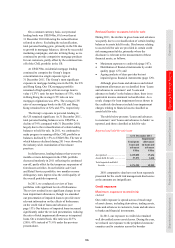
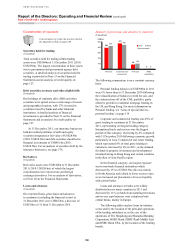
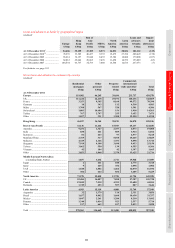
On a constant currency basis, our personal
lending book was US$394bn, 6% lower than at
31 December 2010 following the reclassification
referred to above. Excluding the reclassification,
total personal lending grew, primarily in the UK due
to growth in mortgage balances, driven by successful
marketing campaigns, and also in Hong Kong, as we
continued to provide competitive mortgage products
for our customers, partly offset by the continued run-
off of the CML portfolio in the US.
At US$279bn, residential mortgage lending
continued to comprise the Group’s largest
concentration in a single exposure type at
31 December 2011. The Group’s most significant
exposure to mortgage lending was in the UK, the US
and Hong Kong. Our UK mortgage portfolio
remained of high quality with an average loan to
value (‘LTV’) ratio for new business of 53%, while
in Hong Kong the average LTV ratio on new
mortgage originations was 49%. The average LTV
ratio of our mortgage books in the UK and Hong
Kong remained low at 52% and 37%, respectively.
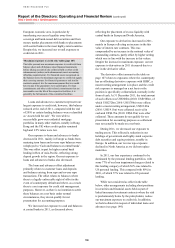
The Group’s exposure to personal lending in
the US remained significant. At 31 December 2011,
total personal lending balances were US$67bn, a
decline of 39% compared with 31 December 2010,
largely due to the reclassification of certain lending
balances to held for sale. In 2011, we continued to
make progress in running off the CML portfolio as
balances declined by 15% to US$49.5bn. The rate at
which balances declined during 2011 was slowed by
the industry-wide examination of foreclosure
practices.
In dollar terms, lending balances that were two
months or more delinquent in the CML portfolio
decreased modestly in 2011 reflecting the continued
run-off, partly offset by the temporary suspension of
foreclosure activities. In our held-for-sale Card
and Retail Services portfolio, two months or more
delinquency rates improved as the credit quality of
the overall portfolio improved.
In 2011, we conducted a review of loan
portfolios with significant levels of forbearance.
The review resulted in no significant change in our
loan impairment allowances, though we amended
our presentation of impaired loans to provide more
relevant information on the effects of forbearance
on the credit risk of loans and advances (see
page 133). Our balance of impaired loans increased
significantly under the revised presentation, reducing
the ratio of total impairment allowances to impaired
loans. On a restated basis, this ratio was 42.3%
(2010: 43% instead of 71.6% under the previous
presentation).
Reclassification to assets held for sale
During 2011, the decline in gross loans and advances
was partly due to a reclassification of certain lending
balances to assets held for sale. Disclosures relating
to assets held for sale are provided in certain credit
risk management tables, primarily where the
disclosure is relevant to the measurement of these
financial assets, as follows:
• Maximum exposure to credit risk (page 107);
• Distribution of financial instruments by credit
quality (page 127); and
• Ageing analysis of days past due but not
impaired gross financial instruments (page 129).
Although gross loans and advances and related
impairment allowances are reclassified from ‘Loans
and advances to customers’ and ‘Loans and
advances to banks’ in the balance sheet, there is no
equivalent income statement reclassification. As a
result, charges for loan impairment losses shown in
the credit risk disclosures include loan impairment
charges relating to financial assets classified as
assets held for sale.
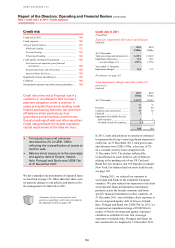
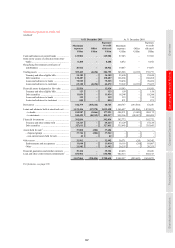
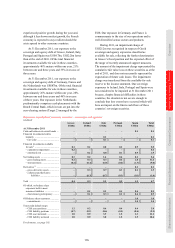
The table below presents ‘Loans and advances
to customers’ and ‘Loans and advances to banks’ as
reported, and those classified as held for sale:
Reported and held-for-sale loans
At 31 December 2011
Total gross
loans and
advances
Impairment
allowances
on loans and
advances
US$m US$m
As reported ............................... 1,139,052 17,636
Assets held for sale .................. 37,273 1,614
Total reported and held
for sale ................................. 1,176,325 19,250
2010 comparative data have not been separately
presented for the credit risk management disclosures
as the amounts are insignificant.
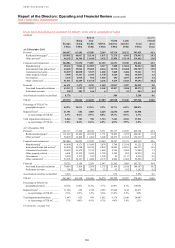
Credit exposure
Maximum exposure to credit risk
(Audited)
Our credit exposure is spread across a broad range
of asset classes, including derivatives, trading assets,
loans and advances to customers, loans and advances
to banks and financial investments.
In 2011, our exposure to credit risk remained
well diversified across asset classes. During the year,
we reduced our exposure to the peripheral eurozone
countries and to countries across the broader