HSBC 2011 Annual Report Download - page 156
Download and view the complete annual report
Please find page 156 of the 2011 HSBC annual report below. You can navigate through the pages in the report by either clicking on the pages listed below, or by using the keyword search tool below to find specific information within the annual report.-
 1
1 -
2
-
3
-
4
-
5
-
6
-
7
-
8
-
9
-
10
-
11
-
12
-
13
-
14
-
15
-
16
-
17
-
18
-
19
-
20
-
21
-
22
-
23
-
24
-
25
-
26
-
27
-
28
-
29
-
30
-
31
-
32
-
33
-
34
-
35
-
36
-
37
-
38
-
39
-
40
-
41
-
42
-
43
-
44
-
45
-
46
-
47
-
48
-
49
-
50
-
51
-
52
-
53
-
54
-
55
-
56
-
57
-
58
-
59
-
60
-
61
-
62
-
63
-
64
-
65
-
66
-
67
-
68
-
69
-
70
-
71
-
72
-
73
-
74
-
75
-
76
-
77
-
78
-
79
-
80
-
81
-
82
-
83
-
84
-
85
-
86
-
87
-
88
-
89
-
90
-
91
-
92
-
93
-
94
-
95
-
96
-
97
-
98
-
99
-
100
-
101
-
102
-
103
-
104
-
105
-
106
-
107
-
108
-
109
-
110
-
111
-
112
-
113
-
114
-
115
-
116
-
117
-
118
-
119
-
120
-
121
-
122
-
123
-
124
-
125
-
126
-
127
-
128
-
129
-
130
-
131
-
132
-
133
-
134
-
135
-
136
-
137
-
138
-
139
-
140
-
141
-
142
-
143
-
144
-
145
-
 146
146 -
 147
147 -
 148
148 -
 149
149 -
 150
150 -
 151
151 -
 152
152 -
 153
153 -
 154
154 -
 155
155 -
 156
156 -
 157
157 -
 158
158 -
 159
159 -
 160
160 -
 161
161 -
 162
162 -
 163
163 -
 164
164 -
 165
165 -
 166
166 -
167
-
168
-
169
-
170
-
171
-
172
-
173
-
174
-
175
-
176
-
177
-
178
-
179
-
180
-
181
-
182
-
183
-
184
-
185
-
186
-
187
-
188
-
189
-
190
-
191
-
192
-
193
-
194
-
195
-
196
-
197
-
198
-
199
-
200
-
201
-
202
-
203
-
204
-
205
-
206
-
207
-
208
-
209
-
210
-
211
-
212
-
213
-
214
-
215
-
216
-
217
-
218
-
219
-
220
-
221
-
222
-
223
-
224
-
225
-
226
-
227
-
228
-
229
-
230
-
231
-
232
-
233
-
234
-
235
-
236
-
237
-
238
-
239
-
240
-
241
-
242
-
243
-
244
-
245
-
246
-
247
-
248
-
249
-
250
-
251
-
252
-
253
-
254
-
255
-
256
-
257
-
258
-
259
-
260
-
261
-
262
-
263
-
264
-
265
-
266
-
267
-
268
-
269
-
270
-
271
-
272
-
273
-
274
-
275
-
276
-
277
-
278
-
279
-
280
-
281
-
282
-
283
-
284
-
285
-
286
-
287
-
288
-
289
-
290
-
291
-
292
-
293
-
294
-
295
-
296
-
297
-
298
-
299
-
300
-
301
-
302
-
303
-
304
-
305
-
306
-
307
-
308
-
309
-
310
-
311
-
312
-
313
-
314
-
315
-
316
-
317
-
318
-
319
-
320
-
321
-
322
-
323
-
324
-
325
-
326
-
327
-
328
-
329
-
330
-
331
-
332
-
333
-
334
-
335
-
336
-
337
-
338
-
339
-
340
-
341
-
342
-
343
-
344
-
345
-
346
-
347
-
348
-
349
-
350
-
351
-
352
-
353
-
354
-
355
-
356
-
357
-
358
-
359
-
360
-
361
-
362
-
363
-
364
-
365
-
366
-
367
-
368
-
369
-
370
-
371
-
372
-
373
-
374
-
375
-
376
-
377
-
378
-
379
-
380
-
381
-
382
-
383
-
384
-
385
-
386
-
387
-
388
-
389
-
390
-
391
-
392
-
393
-
394
-
395
-
396
-
397
-
398
-
399
-
400
-
401
-
402
-
403
-
404
-
405
-
406
-
407
-
408
-
409
-
410
-
411
-
412
-
413
-
414
-
415
-
416
-
417
-
418
-
419
-
420
-
421
-
422
-
423
-
424
-
425
-
426
-
427
-
428
-
429
-
430
-
431
-
432
-
433
-
434
-
435
-
436
-
437
-
438
-
439
-
440
 |
 |

HSBC HOLDINGS PLC
Report of the Directors: Operating and Financial Review (continued)
Risk > Credit risk > Securitisation exposures and other structured products
154
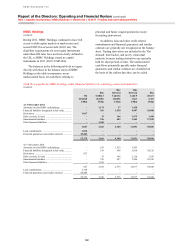
impairment of US$42m on assets was recognised
in 2011 (2010: US$48m) as losses were incurred
under current accounting impairment rules. Our
expectation of cash losses on the underlying assets
did not increase from that at 31 December 2010. Of
the above impairment, there were US$5m of write-
backs (2010: US$54m – impairment) in the SICs.
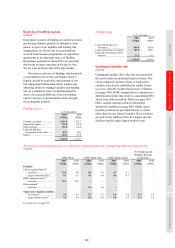
US Alt-A residential mortgage-related assets
During 2011, principal paydowns along with general
spread widening, particularly in the latter stages of
the year, contributed to a reduction in the carrying
values for Alt-A assets from the levels seen in 2010.
Further impairments of US$687m (2010: US$884m)
were recorded as losses were incurred under the
accounting rules described above. Of this
impairment, US$344m (2010: US$450m) occurred
in the SICs, of which US$318m (2010: US$450m)
was borne by the capital note holders.
At 31 December 2011, 9% (US$0.4bn) of these
assets were rated AA or AAA (2010: 9%
(US$0.5bn)).
Commercial property mortgage-related assets
Of our total of US$9.5bn (2010: US$10.8bn)
of commercial property mortgage-related assets,
US$4.9bn related to US-originated assets (2010:
US$5.2bn). Spreads tightened on both US and non-
US commercial property mortgage-related assets
during 2011. Impairments of US$36m (2010:
US$5m) were recognised in 2011.
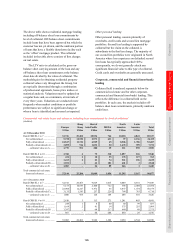
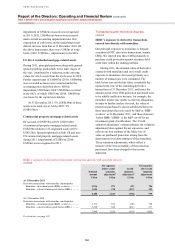
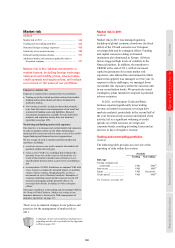
Transactions with monoline insurers
(Audited)
HSBC’s exposure to derivative transactions
entered into directly with monolines
Our principal exposure to monolines is through
a number of OTC derivative transactions, mainly
CDSs. We entered into these CDSs primarily to
purchase credit protection against securities held
at the time within the trading portfolio.
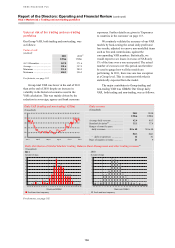
During 2011, the notional value of derivative
contracts with monolines and our overall credit
exposure to monolines decreased primarily as a
number of transactions were commuted. The
table below sets out the fair value, essentially the
replacement cost, of the remaining derivative
transactions at 31 December 2011, and hence the
amount at risk if the CDS protection purchased were
to be wholly ineffective because, for example, the
monoline insurer was unable to meet its obligations.
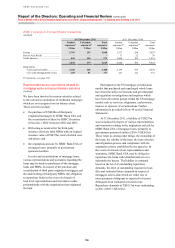
In order to further analyse that risk, the value of
protection purchased is shown subdivided between
those monolines that were rated by S&P at ‘BBB-
or above’ at 31 December 2011, and those that were
‘below BBB–’ (BBB– is the S&P cut-off for an
investment grade classification). The ‘Credit
valuation adjustment’ column indicates the valuation
adjustment taken against the net exposures, and
reflects our best estimate of the likely loss of
value on purchased protection arising from the
deterioration in creditworthiness of the monolines.
These valuation adjustments, which reflect a
measure of the irrecoverability of the protection
purchased, have been charged to the income
statement.
HSBC’s exposure to derivative transactions entered into directly with monoline insurers
(Audited)
Notional
amount
Net exposure
before credit
valuation
adjustment40
Credit
valuation
adjustment41
Net exposure
after credit
valuation
adjustment
US$m US$m US$m US$m
At 31 December 2011
Derivative transactions with monoline counterparties
Monoline – investment grade (BBB– or above) .............. 4,936 873 (87) 786
Monoline – sub-investment grade (below BBB–) ........... 1,552 370 (217) 153
6,488 1,243 (304) 939
At 31 December 2010
Derivative transactions with monoline counterparties
Monoline – investment grade (BBB– or above) .............. 5,179 876 (88) 788
Monoline – sub-investment grade (below BBB–) ........... 2,290 648 (431) 217
7,469 1,524 (519) 1,005
For footnotes, see page 185.