HSBC 2011 Annual Report Download - page 336
Download and view the complete annual report
Please find page 336 of the 2011 HSBC annual report below. You can navigate through the pages in the report by either clicking on the pages listed below, or by using the keyword search tool below to find specific information within the annual report.-
 1
1 -
2
-
3
-
4
-
5
-
6
-
7
-
8
-
9
-
10
-
11
-
12
-
13
-
14
-
15
-
16
-
17
-
18
-
19
-
20
-
21
-
22
-
23
-
24
-
25
-
26
-
27
-
28
-
29
-
30
-
31
-
32
-
33
-
34
-
35
-
36
-
37
-
38
-
39
-
40
-
41
-
42
-
43
-
44
-
45
-
46
-
47
-
48
-
49
-
50
-
51
-
52
-
53
-
54
-
55
-
56
-
57
-
58
-
59
-
60
-
61
-
62
-
63
-
64
-
65
-
66
-
67
-
68
-
69
-
70
-
71
-
72
-
73
-
74
-
75
-
76
-
77
-
78
-
79
-
80
-
81
-
82
-
83
-
84
-
85
-
86
-
87
-
88
-
89
-
90
-
91
-
92
-
93
-
94
-
95
-
96
-
97
-
98
-
99
-
100
-
101
-
102
-
103
-
104
-
105
-
106
-
107
-
108
-
109
-
110
-
111
-
112
-
113
-
114
-
115
-
116
-
117
-
118
-
119
-
120
-
121
-
122
-
123
-
124
-
125
-
126
-
127
-
128
-
129
-
130
-
131
-
132
-
133
-
134
-
135
-
136
-
137
-
138
-
139
-
140
-
141
-
142
-
143
-
144
-
145
-
146
-
147
-
148
-
149
-
150
-
151
-
152
-
153
-
154
-
155
-
156
-
157
-
158
-
159
-
160
-
161
-
162
-
163
-
164
-
165
-
166
-
167
-
168
-
169
-
170
-
171
-
172
-
173
-
174
-
175
-
176
-
177
-
178
-
179
-
180
-
181
-
182
-
183
-
184
-
185
-
186
-
187
-
188
-
189
-
190
-
191
-
192
-
193
-
194
-
195
-
196
-
197
-
198
-
199
-
200
-
201
-
202
-
203
-
204
-
205
-
206
-
207
-
208
-
209
-
210
-
211
-
212
-
213
-
214
-
215
-
216
-
217
-
218
-
219
-
220
-
221
-
222
-
223
-
224
-
225
-
226
-
227
-
228
-
229
-
230
-
231
-
232
-
233
-
234
-
235
-
236
-
237
-
238
-
239
-
240
-
241
-
242
-
243
-
244
-
245
-
246
-
247
-
248
-
249
-
250
-
251
-
252
-
253
-
254
-
255
-
256
-
257
-
258
-
259
-
260
-
261
-
262
-
263
-
264
-
265
-
266
-
267
-
268
-
269
-
270
-
271
-
272
-
273
-
274
-
275
-
276
-
277
-
278
-
279
-
280
-
281
-
282
-
283
-
284
-
285
-
286
-
287
-
288
-
289
-
290
-
291
-
292
-
293
-
294
-
295
-
296
-
297
-
298
-
299
-
300
-
301
-
302
-
303
-
304
-
305
-
306
-
307
-
308
-
309
-
310
-
311
-
312
-
313
-
314
-
315
-
316
-
317
-
318
-
319
-
320
-
321
-
322
-
323
-
324
-
325
-
 326
326 -
 327
327 -
 328
328 -
 329
329 -
 330
330 -
 331
331 -
 332
332 -
 333
333 -
 334
334 -
 335
335 -
 336
336 -
 337
337 -
 338
338 -
 339
339 -
 340
340 -
 341
341 -
 342
342 -
 343
343 -
 344
344 -
 345
345 -
 346
346 -
347
-
348
-
349
-
350
-
351
-
352
-
353
-
354
-
355
-
356
-
357
-
358
-
359
-
360
-
361
-
362
-
363
-
364
-
365
-
366
-
367
-
368
-
369
-
370
-
371
-
372
-
373
-
374
-
375
-
376
-
377
-
378
-
379
-
380
-
381
-
382
-
383
-
384
-
385
-
386
-
387
-
388
-
389
-
390
-
391
-
392
-
393
-
394
-
395
-
396
-
397
-
398
-
399
-
400
-
401
-
402
-
403
-
404
-
405
-
406
-
407
-
408
-
409
-
410
-
411
-
412
-
413
-
414
-
415
-
416
-
417
-
418
-
419
-
420
-
421
-
422
-
423
-
424
-
425
-
426
-
427
-
428
-
429
-
430
-
431
-
432
-
433
-
434
-
435
-
436
-
437
-
438
-
439
-
440
 |
 |

HSBC HOLDINGS PLC
Notes on the Financial Statements (continued)
10 – Tax / 11 – Dividends / 12 – Earnings per share
334
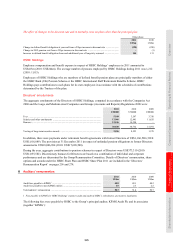
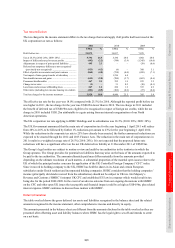
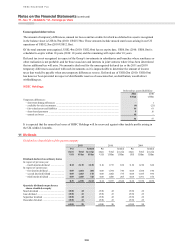
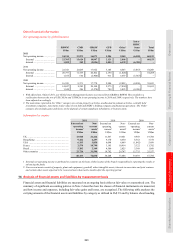
Unrecognised deferred tax
The amount of temporary differences, unused tax losses and tax credits for which no deferred tax asset is recognised
in the balance sheet is US$14.7bn (2010: US$15.3bn). These amounts include unused state losses arising in our US
operations of US$12.5bn (2010 US$12.5bn).
Of the total amounts unrecognised, US$2.4bn (2010: US$2.6bn) has no expiry date, US$0.1bn (2010: US$0.1bn) is
scheduled to expire within 10 years (2010: 10 years) and the remaining will expire after 10 years.
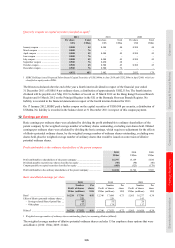
Deferred tax is not recognised in respect of the Group’s investments in subsidiaries and branches where remittance or
other realisation is not probable, and for those associates and interests in joint ventures where it has been determined
that no additional tax will arise. No amount is disclosed for the unrecognised deferred tax or the 2011 and 2010
temporary differences associated with such investments as it is impracticable to determine the amount of income
taxes that would be payable when any temporary differences reverse. Deferred tax of US$0.2bn (2010: US$0.1bn)
has however been provided in respect of distributable reserves of associates that, on distribution, would attract
withholding tax.
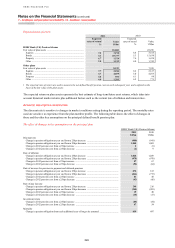
HSBC Holdings
Deferred tax assets/(liabilities)
2011 2010
US$m US$m
Temporary differences:
– short-term timing differences ............................................................................................................ – 1
– available-for-sale investments ........................................................................................................... (4) (21)
– fair valued assets and liabilities ........................................................................................................ 46 61
– share-based payments ........................................................................................................................ 9 16
– unused tax losses ............................................................................................................................... 40 –
91 57
It is expected that the unused tax losses of HSBC Holdings will be recovered against other taxable profits arising in
the UK within 12 months.
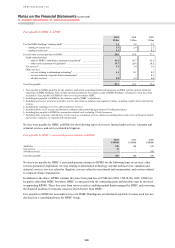
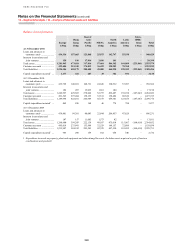
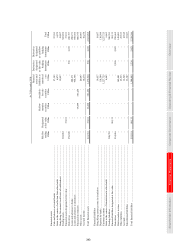
11 Dividends
Dividends to shareholders of the parent company
2011 2010 2009
Per
share
US$
Total
US$m
Settled
in scrip
US$m
Per
share
US$
Total
US$m
Settled
in scrip
US$m
Per
share
US$
Total
US$m
Settled
in scrip
US$m
Dividends declared on ordinary shares
In respect of previous year:
– fourth interim dividend ....................... 0.12 2,119 1,130 0.10 1,733 838 0.10 1,210 624
In respect of current year:
– first interim dividend ........................... 0.09 1,601 204 0.08 1,394 746 0.08 1,384 190
– second interim dividend ...................... 0.09 1,603 178 0.08 1,402 735 0.08 1,385 696
– third interim dividend .......................... 0.09 1,605 720 0.08 1,408 205 0.08 1,391 160
0.39 6,928 2,232 0.34 5,937 2,524 0.34 5,370 1,670
Quarterly dividends on preference
shares classified as equity
March dividend ........................................... 15.50 22 15.50 22 15.50 22
June dividend .............................................. 15.50 23 15.50 23 15.50 23
September dividend .................................... 15.50 22 15.50 22 15.50 22
December dividend ..................................... 15.50 23 15.50 23 15.50 23
62.00 90 62.00 90 62.00 90