HSBC 2011 Annual Report Download - page 187
Download and view the complete annual report
Please find page 187 of the 2011 HSBC annual report below. You can navigate through the pages in the report by either clicking on the pages listed below, or by using the keyword search tool below to find specific information within the annual report.-
 1
1 -
2
-
3
-
4
-
5
-
6
-
7
-
8
-
9
-
10
-
11
-
12
-
13
-
14
-
15
-
16
-
17
-
18
-
19
-
20
-
21
-
22
-
23
-
24
-
25
-
26
-
27
-
28
-
29
-
30
-
31
-
32
-
33
-
34
-
35
-
36
-
37
-
38
-
39
-
40
-
41
-
42
-
43
-
44
-
45
-
46
-
47
-
48
-
49
-
50
-
51
-
52
-
53
-
54
-
55
-
56
-
57
-
58
-
59
-
60
-
61
-
62
-
63
-
64
-
65
-
66
-
67
-
68
-
69
-
70
-
71
-
72
-
73
-
74
-
75
-
76
-
77
-
78
-
79
-
80
-
81
-
82
-
83
-
84
-
85
-
86
-
87
-
88
-
89
-
90
-
91
-
92
-
93
-
94
-
95
-
96
-
97
-
98
-
99
-
100
-
101
-
102
-
103
-
104
-
105
-
106
-
107
-
108
-
109
-
110
-
111
-
112
-
113
-
114
-
115
-
116
-
117
-
118
-
119
-
120
-
121
-
122
-
123
-
124
-
125
-
126
-
127
-
128
-
129
-
130
-
131
-
132
-
133
-
134
-
135
-
136
-
137
-
138
-
139
-
140
-
141
-
142
-
143
-
144
-
145
-
146
-
147
-
148
-
149
-
150
-
151
-
152
-
153
-
154
-
155
-
156
-
157
-
158
-
159
-
160
-
161
-
162
-
163
-
164
-
165
-
166
-
167
-
168
-
169
-
170
-
171
-
172
-
173
-
174
-
175
-
176
-
 177
177 -
 178
178 -
 179
179 -
 180
180 -
 181
181 -
 182
182 -
 183
183 -
 184
184 -
 185
185 -
 186
186 -
 187
187 -
 188
188 -
 189
189 -
 190
190 -
 191
191 -
 192
192 -
 193
193 -
 194
194 -
 195
195 -
 196
196 -
 197
197 -
198
-
199
-
200
-
201
-
202
-
203
-
204
-
205
-
206
-
207
-
208
-
209
-
210
-
211
-
212
-
213
-
214
-
215
-
216
-
217
-
218
-
219
-
220
-
221
-
222
-
223
-
224
-
225
-
226
-
227
-
228
-
229
-
230
-
231
-
232
-
233
-
234
-
235
-
236
-
237
-
238
-
239
-
240
-
241
-
242
-
243
-
244
-
245
-
246
-
247
-
248
-
249
-
250
-
251
-
252
-
253
-
254
-
255
-
256
-
257
-
258
-
259
-
260
-
261
-
262
-
263
-
264
-
265
-
266
-
267
-
268
-
269
-
270
-
271
-
272
-
273
-
274
-
275
-
276
-
277
-
278
-
279
-
280
-
281
-
282
-
283
-
284
-
285
-
286
-
287
-
288
-
289
-
290
-
291
-
292
-
293
-
294
-
295
-
296
-
297
-
298
-
299
-
300
-
301
-
302
-
303
-
304
-
305
-
306
-
307
-
308
-
309
-
310
-
311
-
312
-
313
-
314
-
315
-
316
-
317
-
318
-
319
-
320
-
321
-
322
-
323
-
324
-
325
-
326
-
327
-
328
-
329
-
330
-
331
-
332
-
333
-
334
-
335
-
336
-
337
-
338
-
339
-
340
-
341
-
342
-
343
-
344
-
345
-
346
-
347
-
348
-
349
-
350
-
351
-
352
-
353
-
354
-
355
-
356
-
357
-
358
-
359
-
360
-
361
-
362
-
363
-
364
-
365
-
366
-
367
-
368
-
369
-
370
-
371
-
372
-
373
-
374
-
375
-
376
-
377
-
378
-
379
-
380
-
381
-
382
-
383
-
384
-
385
-
386
-
387
-
388
-
389
-
390
-
391
-
392
-
393
-
394
-
395
-
396
-
397
-
398
-
399
-
400
-
401
-
402
-
403
-
404
-
405
-
406
-
407
-
408
-
409
-
410
-
411
-
412
-
413
-
414
-
415
-
416
-
417
-
418
-
419
-
420
-
421
-
422
-
423
-
424
-
425
-
426
-
427
-
428
-
429
-
430
-
431
-
432
-
433
-
434
-
435
-
436
-
437
-
438
-
439
-
440
 |
 |

185
Overview Operating & Financial Review Corporate Governance Financial Statements Shareholder Information
Footnotes to Risk
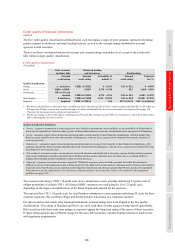
Credit risk
1 Includes loan impairment charges relating to assets reclassified as held for sale.
2 2010 comparative data have not been separately presented as the amounts are insignificant.
3 The amount of the loan commitments reflects, where relevant, the expected level of take-up of pre-approved loan offers made by
mailshots to personal customers. In addition to those amounts, there is a further maximum possible exposure to credit risk of US$171bn
(2010: US$220bn), reflecting the full take-up of such irrevocable loan commitments. The take-up of such offers is generally at modest
levels.
4 Residential mortgages include Hong Kong Government Home Ownership Scheme loans of US$3.3bn at 31 December 2011
(2010: US$3.5bn). Where disclosed, earlier comparatives were 2009: US$3.5bn; 2008: US$3.9bn; 2007: US$3.9bn.
5 Other personal loans and advances include second lien mortgages and other property-related lending.
6 These categories were formerly combined under a single heading, ‘Commercial, industrial and international trade’.
7 Other commercial loans and advances include advances in respect of agriculture, transport, energy and utilities.
8 During 2011 the Group adopted a more stringent treatment for the presentation of impaired loans for geographical regions with
significant levels of forbearance. As a result loans and advances have been classified as impaired that under the previous disclosure
convention would otherwise have been classified as neither past due nor impaired or past due but not impaired. The comparative
balances for 2010 were restated to comply with the revised segmentation, restatement of comparatives prior to 2010 is impracticable
(see page 133, ‘Impaired loans disclosure’ for further details).
9 The impairment allowances on loans and advances to banks in 2011 relate to the geographical regions, Europe and North America.
10 The impairment allowances on loans and advances to banks in 2010 relate to geographical regions, Europe, Middle East and North
Africa, and North America.
11 Our available-for-sale holdings in sovereign and agency debt of Italy and Spain include debt held to support insurance contracts which
provide discretionary profit participation to policyholders. For such contracts, unrealised movements in liabilities are recognised in
other comprehensive income, following the treatment of the unrealised movements on related available-for-sale assets. To the extent
that the movements are matched, no movement in the available-for-sale reserve is recognised. For those available-for-sale debt
instruments described above that are not held to support insurance contracts which provide discretionary profit participation to
policyholders, the available-for-sale reserves at 31 December 2011 were insignificant.
12 Derivative assets net of collateral and derivative liabilities for which a legally enforceable right of offset exists.
13 Includes residential mortgages of HSBC Bank USA and HSBC Finance.
14 Comprising Hong Kong, Rest of Asia-Pacific, Middle East and North Africa, and Latin America.
15 HSBC Finance lending is shown on a management basis and includes loans transferred to HSBC USA Inc. which are managed by
HSBC Finance.
16 Property acquired through foreclosure is initially recognised at the lower of the carrying amount of the loan or its fair value less
estimated costs to sell (‘Initial Foreclosed Property Carrying Amount’). The average loss on sale of foreclosed properties is calculated
as cash proceeds less the Initial Foreclosed Properties Carrying Amount divided by the unpaid loan principal balance prior to write-
down (excluding any accrued finance income) plus certain other ancillary disbursements that, by law, are reimbursable from the cash
proceeds (e.g. real estate tax advances) and were incurred prior to our taking title to the property. This ratio represents the portion of
our total loss on foreclosed properties that occurred after we took title to the property. The comparative data are restated (previously
divided by the Initial Foreclosed Property Carrying Amount).
17 The average total loss on foreclosed properties includes both the loss on sale of the foreclosed property as discussed in footnote 16 and
the cumulative write-downs recognised on the loans up to the time we took title to the property. This calculation of the average total
loss on foreclosed properties uses the unpaid loan principal balance prior to write-down (excluding any accrued finance income) plus
certain other ancillary disbursements that, by law, are reimbursable from the cash proceeds (e.g. real estate tax advances) and were
incurred prior to our taking title to the property.
18 Percentages are expressed as a function of the relevant loans and receivables balance.
19 Impairment allowances are not reported for financial instruments whereby the carrying amount is reduced directly for impairment and
not through the use of an allowance account.
20 Impairment is not measured for assets held in trading portfolios or designated at fair value as assets in such portfolios are managed
according to movements in fair value, and the fair value movement is taken directly to the income statement. Consequently, we report
all such balances under ‘Neither past due nor impaired’.
21 Loans and advances to customers includes asset-backed securities that have been externally rated as strong (2011: US$3.5bn; 2010:
US$4.1bn), good (2011: US$476m; 2010: US$627m), satisfactory (2011: US$428m; 2010: US$452m), sub-standard (2011: US$556m;
2010: US$669m) and impaired (2011: US$229m; 2010: US$29m).
22 Included in this category are loans of US$2.9bn (2010: US$3.7bn) that have been re-aged once and were less than 60 days past due at
the point of re-age. These loans are not classified as impaired following re-age due to the overall expectation that these customers will
perform on the original contractual terms of their borrowing in the future.
23 Impaired loans and advances are those classified as CRR 9, CRR 10, EL 9 or EL 10, retail loans 90 days or more past due, unless
individually they have been assessed as not impaired (see page 128, ‘Past due but not impaired gross financial instruments’) and
renegotiated loans and advances meeting the criteria to be disclosed as impaired (see page 133).
24 Collectively assessed loans and advances comprise homogeneous groups of loans that are not considered individually significant, and
loans subject to individual assessment where no impairment has been identified on an individual basis, but on which a collective
impairment allowance has been calculated to reflect losses which have been incurred but not yet identified.
25 Collectively assessed loans and advances not impaired are those classified as CRR1 to CRR8 and EL1 to EL8 but excluding retail loans
90 days past due and renegotiated loans and advances meeting the criteria to be disclosed as impaired.
26 Included within ‘Exchange and other movements’ is US$1.6bn of impairment allowances reclassified to held for sale.
27 Net of repo transactions, settlement accounts and stock borrowings.
28 As a percentage of loans and advances to banks and loans and advances to customers, as applicable.
29 Includes movement in impairment allowances against banks.
30 See table below ‘Net loan impairment charge to the income statement by geographical region’.