HSBC 2011 Annual Report Download - page 85
Download and view the complete annual report
Please find page 85 of the 2011 HSBC annual report below. You can navigate through the pages in the report by either clicking on the pages listed below, or by using the keyword search tool below to find specific information within the annual report.-
 1
1 -
2
-
3
-
4
-
5
-
6
-
7
-
8
-
9
-
10
-
11
-
12
-
13
-
14
-
15
-
16
-
17
-
18
-
19
-
20
-
21
-
22
-
23
-
24
-
25
-
26
-
27
-
28
-
29
-
30
-
31
-
32
-
33
-
34
-
35
-
36
-
37
-
38
-
39
-
40
-
41
-
42
-
43
-
44
-
45
-
46
-
47
-
48
-
49
-
50
-
51
-
52
-
53
-
54
-
55
-
56
-
57
-
58
-
59
-
60
-
61
-
62
-
63
-
64
-
65
-
66
-
67
-
68
-
69
-
70
-
71
-
72
-
73
-
74
-
 75
75 -
 76
76 -
 77
77 -
 78
78 -
 79
79 -
 80
80 -
 81
81 -
 82
82 -
 83
83 -
 84
84 -
 85
85 -
 86
86 -
 87
87 -
 88
88 -
 89
89 -
 90
90 -
 91
91 -
 92
92 -
 93
93 -
 94
94 -
 95
95 -
96
-
97
-
98
-
99
-
100
-
101
-
102
-
103
-
104
-
105
-
106
-
107
-
108
-
109
-
110
-
111
-
112
-
113
-
114
-
115
-
116
-
117
-
118
-
119
-
120
-
121
-
122
-
123
-
124
-
125
-
126
-
127
-
128
-
129
-
130
-
131
-
132
-
133
-
134
-
135
-
136
-
137
-
138
-
139
-
140
-
141
-
142
-
143
-
144
-
145
-
146
-
147
-
148
-
149
-
150
-
151
-
152
-
153
-
154
-
155
-
156
-
157
-
158
-
159
-
160
-
161
-
162
-
163
-
164
-
165
-
166
-
167
-
168
-
169
-
170
-
171
-
172
-
173
-
174
-
175
-
176
-
177
-
178
-
179
-
180
-
181
-
182
-
183
-
184
-
185
-
186
-
187
-
188
-
189
-
190
-
191
-
192
-
193
-
194
-
195
-
196
-
197
-
198
-
199
-
200
-
201
-
202
-
203
-
204
-
205
-
206
-
207
-
208
-
209
-
210
-
211
-
212
-
213
-
214
-
215
-
216
-
217
-
218
-
219
-
220
-
221
-
222
-
223
-
224
-
225
-
226
-
227
-
228
-
229
-
230
-
231
-
232
-
233
-
234
-
235
-
236
-
237
-
238
-
239
-
240
-
241
-
242
-
243
-
244
-
245
-
246
-
247
-
248
-
249
-
250
-
251
-
252
-
253
-
254
-
255
-
256
-
257
-
258
-
259
-
260
-
261
-
262
-
263
-
264
-
265
-
266
-
267
-
268
-
269
-
270
-
271
-
272
-
273
-
274
-
275
-
276
-
277
-
278
-
279
-
280
-
281
-
282
-
283
-
284
-
285
-
286
-
287
-
288
-
289
-
290
-
291
-
292
-
293
-
294
-
295
-
296
-
297
-
298
-
299
-
300
-
301
-
302
-
303
-
304
-
305
-
306
-
307
-
308
-
309
-
310
-
311
-
312
-
313
-
314
-
315
-
316
-
317
-
318
-
319
-
320
-
321
-
322
-
323
-
324
-
325
-
326
-
327
-
328
-
329
-
330
-
331
-
332
-
333
-
334
-
335
-
336
-
337
-
338
-
339
-
340
-
341
-
342
-
343
-
344
-
345
-
346
-
347
-
348
-
349
-
350
-
351
-
352
-
353
-
354
-
355
-
356
-
357
-
358
-
359
-
360
-
361
-
362
-
363
-
364
-
365
-
366
-
367
-
368
-
369
-
370
-
371
-
372
-
373
-
374
-
375
-
376
-
377
-
378
-
379
-
380
-
381
-
382
-
383
-
384
-
385
-
386
-
387
-
388
-
389
-
390
-
391
-
392
-
393
-
394
-
395
-
396
-
397
-
398
-
399
-
400
-
401
-
402
-
403
-
404
-
405
-
406
-
407
-
408
-
409
-
410
-
411
-
412
-
413
-
414
-
415
-
416
-
417
-
418
-
419
-
420
-
421
-
422
-
423
-
424
-
425
-
426
-
427
-
428
-
429
-
430
-
431
-
432
-
433
-
434
-
435
-
436
-
437
-
438
-
439
-
440
 |
 |

83
Overview Operating & Financial Review Corporate Governance Financial Statements Shareholder Information
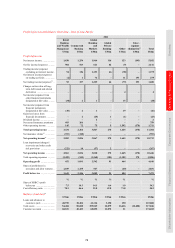
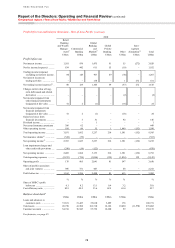
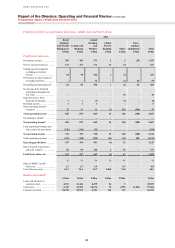
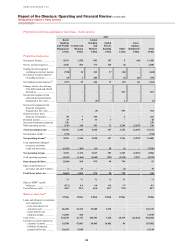
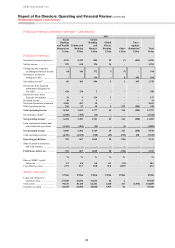
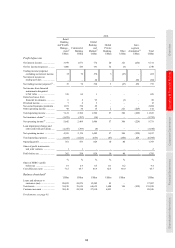
Profit/(loss) before tax by country within global businesses
Retail
Banking
and Wealth
Management17
US$m
Commercial
Banking
US$m
Global
Banking
and
Markets17
US$m
Global
Private
Banking
US$m
Other
US$m
Total
US$m
2011
US ........................................................ (2,861) 431 567 83 782 (998)
Canada ................................................. 147 545 265 – 8 965
Bermuda ............................................... 49 26 43 7 9 134
Other .................................................... – – – – (1) (1)
(2,665) 1,002 875 90 798 100
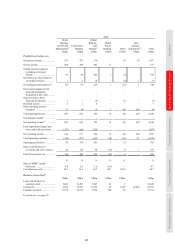
2010
US ........................................................ (2,305) 402 1,284 113 (39) (545)
Canada ................................................. 131 505 227 – 4 867
Bermuda ............................................... 58 32 38 (3) 7 132
Other .................................................... – – – 1 (1) –
(2,116) 939 1,549 111 (29) 454
2009
US69 ...................................................... (5,275) 158 488 (49) (3,626) (8,304)
Canada ................................................. 34 347 142 – (100) 423
Bermuda ............................................... 60 37 36 (2) 10 141
Other .................................................... – 1 1 1 (1) 2
(5,181) 543 667 (50) (3,717) (7,738)
For footnotes, see page 95.
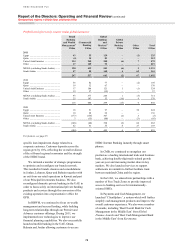
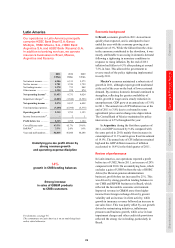
Review of performance
Our operations in North America reported a profit
before tax of US$100m in 2011, compared with
US$454m in 2010, a decrease of 78%. Reported
profits included favourable movements on our own
debt designated at fair value of US$970m resulting
from changes in credit spreads, compared with
favourable movements of US$142m and a gain of
US$66m on the sale of our stake in the Wells Fargo
HSBC Trade Bank in 2010. On an underlying basis,
which excludes the above, we reported a pre-tax loss
of US$870m in 2011 compared with a profit before
tax of US$285m in 2010.
Our 2011 North America results continued to be
affected by the pace of recovery of the US economy,
in particular the decline in house prices and high
levels of unemployment, as well as the impact of
proposed regulatory changes and ongoing
compliance initiatives. We expect these factors, as
well as the ongoing delays in foreclosure processes,
to continue to affect our results going forward.
The reduction in our underlying profit was
partly attributable to a decline in GB&M driven
by higher costs, mainly from compliance and
remediation, lower releases of collective loan
impairment allowances and reduced trading income,
which in part reflected the non-recurrence of price
appreciation on assets in the legacy credit portfolio.
In our consumer finance portfolios, revenue
continued to decline following the reduction in
lending balances, and adverse fair value movements
on non-qualifying hedges increased reflecting lower
long-term US interest rates. However, these effects
were partly offset by a corresponding decline in loan
impairment charges.
Performance in the second half of 2011
deteriorated, driven by an increase in adverse fair
value movements on non-qualifying hedges as
US long-term interest rates declined reflecting
increased concerns regarding the pace of US
economic recovery and ongoing eurozone
concerns. In addition, there was a marked rise in
loan impairment charges in our run-off portfolio,
reflecting deterioration in delinquency rates,
and higher estimated costs to obtain and realise
collateral, both related to the industry-wide delays
in foreclosure processing.
Our Canadian business continued to perform
strongly during 2011. Profit before tax increased by
4% to US$955m driven by improved credit quality
in our CMB business, while in GB&M, higher pre-
tax profits were driven by a rise in revenue from
Balance Sheet Management.
In 2011, we made significant progress in our
strategy for our North American businesses. In the
second half of 2011, we announced the sale of our
Card and Retail Services business to Capital One
Financial Group, which we expect to complete in the